


Kavanagh-Putland index bounces on low interest rates
By Gavin R. Putland
In the Great Recession — better known in Australia as the Global Financial Crisis (“GFC”) — the recession in any one country was usually preceded by a fall in property prices in that country. This in turn was normally preceded by a fall in property turnover, as buyers stopped believing in the greater fool while sellers tried to hold out. These events surprised governments, central banks and mainstream economists, but not the Australian property valuer Bryan Kavanagh. In a paper published in 2001, Kavanagh noted that each of the last three recessions in Australia occurred soon after the estimated ratio of property sales to GDP (for the whole financial year) exceeded a certain threshold and returned below it. Kavanagh continued to update his estimate of that ratio, describing it as a “barometer” of the economy. Later I proposed certain modifications to the estimate (see below), whereupon Kavanagh generously renamed it the “Kavanagh-Putland index”.
Early figures from 2008-9 suggested that the K-P index had plummeted again. But Australia was lucky in that its housing market peaked comparatively late: when the Rudd government saw the destruction that falling collateral values had wrought in the USA, there was still time to arrest the decline in Australian home prices. So in October 2008, the government hastily introduced the First Home Owners' Boost (FHOB), which increased the existing First Home Owners' Grant by $14000 for new homes and $7000 for established homes — unlike the Commonwealth Additional Grant of 2001, which was exclusively for new homes. That the Boost was partly available for established homes shows that it was partly intended to prop up prices rather than stimulate activity. In this it was too successful: the ensuing rise in prices was even steeper than the previous one.
Monetary authorities are likewise on notice that they cannot ignore the property market. Neither can they declare their aims with respect thereto, because any change in public expectations on future “capital gains” would immediately be reflected in present prices, frustrating the said aims.
When policymakers start paying attention to a leading indicator that they have previously ignored, they damage the predictive power of that indicator. The damage is minimal if the policy interventions influence the indicator, which in turn actually influences what it predicts. The damage is more severe if the policy interventions are designed to counteract the indicator rather than change it. Let us see what has happened to the predictive power of the K-P index.
The first graph shows the index and the year-on-year change therein:
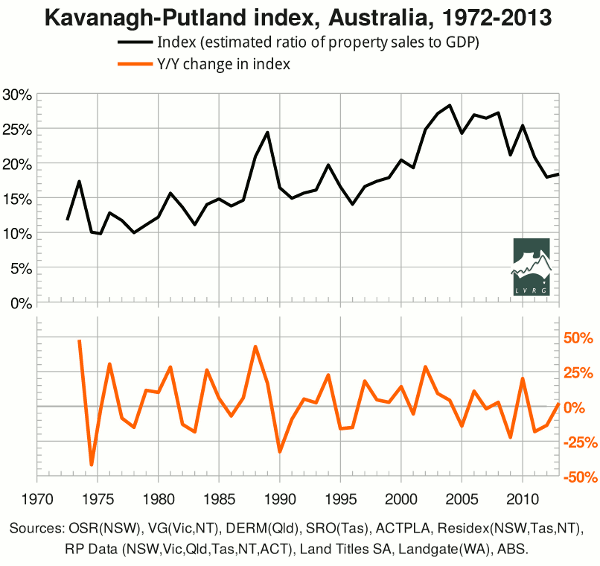
The biggest year-on-year declines are in calendar-year '74 (based on Victoria only) and the financial years ended '90, '09, '83, '11, '95, '96, '78 and '12. The two biggest falls were swiftly followed by notorious recessions. The 3rd-biggest was in the same financial year as the GFC, which gave us only one quarter of economic contraction; the slide towards recession was cut short by policy interventions aimed partly at the property market (e.g. the FHOB and monetary easing) and partly elsewhere (e.g. pink batts, BER and the “cash splash”). The 4th-biggest was the 2nd in consecutive years, and coincided with the recession that ousted the Fraser government. The 5th-biggest and the rest do not correspond to recognized recessions (the two very small contractions in the second half of 1977 seem to have been forgotten). Thus the year-on-year change in the index does not have a clear “recession threshold”, but apparently would have one in the absence of the massive policy interventions of 2008-9.
The second graph shows the index and the two-year change therein:
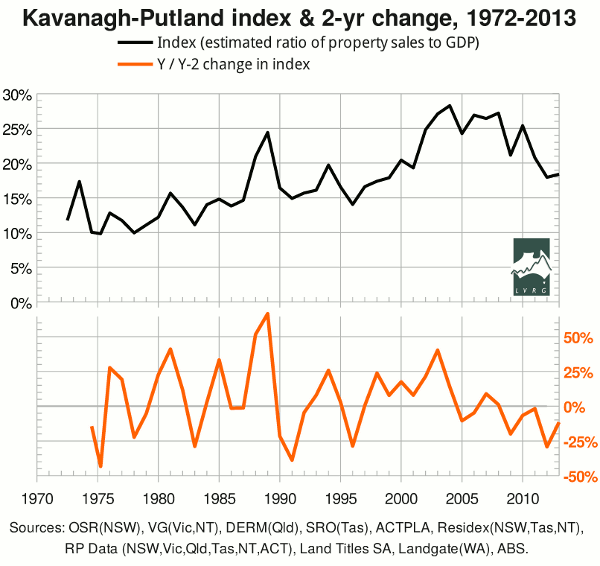
The biggest two-year declines are for '75 (based on half a year's data from Victoria) and the financial years ended '91, '12, '83, '96, '78 and '09. Thus the 4th-biggest fall is associated with a recession while the 3rd-biggest is not (unless perhaps we make an issue of the recession-like upswing in the Roy Morgan unemployment rate), and the 7th-biggest fall is associated with a far worse crisis than the 5th- and 6th-biggest.
Thus the one-year change in the index looks like a better recession predictor than the two-year change. That said, I should note three caveats concerning the one-year change. First, I repeat: as soon as an economic indicator becomes a guide for public policy, its predictive power is compromised. Second, the predictive power of the one-year change in the index relies on small differences (indeed, the order of the list of one-year falls has changed due to revisions in the figures). Third, the index is based exclusively on the property market, whereas the U.S. “tech wreck” of 2000-1 shows that recessions can be precipitated by crashes in other asset markets.
The latest move in the index was slightly upward. As to whether the next move will be up or down, I draw attention to my last article.
Technical notes
The K-P index is an estimate of the ratio of property sales to GDP. It is called an “index”, rather than a simple “ratio”, because it is based on a varying sample. Only Victoria has sales figures dating back to 1972. Qld, WA and NT join the sample in 1979, Tasmania and the ACT in '84, SA in '85, and NSW in '89. Furthermore, because the land titles offices of some jurisdictions have monetized their data, some later figures are available only through secondary sources, and the figures for some jurisdictions in some years are thought to be unreliable because they are outliers or have been subject to alarmingly large “corrections”.
The initial solution, used by Kavanagh from 1991, was to “gross up” early figures by assuming that the missing jurisdictions had fixed fractions of total sales (calculating the fractions from later, actual figures) and to replace suspect figures by interpolation.
The current solution is to add up the property sales in those jurisdictions for which reliable figures are available, and divide by the sum of Gross State Products (GSPs) in the same jurisdictions, so that jurisdictions without reliable figures are simply excluded from the sample. Unfortunately GSP figures from the ABS date back only as far as 1984-5 and are less up-to-date than GDP. Furthermore, due to an apparent change in methodology, GSPs do not add up to GDP before 1989-90. Accordingly, for each year in which GSPs are known, the GSP for each jurisdiction is divided by the total GSP to obtain the “GSP fraction”, which is then multiplied by GDP to obtain the “estimated GSP” for that jurisdiction. For earlier/later years, the earliest/latest available GSP fractions are used. (Because this publication of the index for 2012-3 is comparatively late, the GSP figures for that year are available.)
A further problem is that the figures from Victoria's Valuer-General are for the calendar year while others are for the “financial year ended...” To avoid aggregating calendar-year figures with financial-year figures (as we used to do, causing an unwanted smoothing of the aggregate), we engaged RP Data to supply a quarterly back-series for Victoria from 1975. Thus the first three data points on each graph are for calendar years, and the fourth is for the first half of calendar year 1975, and the rest are for financial years.
We continue to use RP Data's figures for Victoria. In the above graphs, we also use RP Data's figures for 2011-12 and 2012-13 in NSW, Qld, Tas, NT and ACT, for 2007-8 in NSW, and for 2009-10 in Tas. Excluded from the sample are NSW in 2000-1 (which fortunately is not a critical year for interpreting the graphs), NT in 1997-8 (for which the geographic coverage does not match other years), and ACT in 1991-2. Obviously the last two exclusions make little difference to the calculated index.
On 31 January 2013, I wrote to Landgate (WA), inquiring about certain minor discrepancies in past releases of the Business Activity Profile. On 15 February, I received a list of corrections from Landgate's General Manager of Operations. I thank him for his prompt and thorough response. His corrections are incorporated in the above graphs.
From April 2013, Landgate's Business Activity Profile ceased to include the total value of sales. Accordingly, for this year's release of the K-P index, the total value of sales in WA in 2012-13 is estimated by multiplying the total for the first three quarters by the ratio whose denominator is the total value of Queensland sales for the first three quarters, and whose numerator is the total value of Queensland sales for the full year.
