


Housing finance continues its unbalanced rally
By Gavin R. Putland
The ABS has released “5609.0 - Housing Finance, Australia” for June 2013. In the following graph, the seasonally-adjusted value of lending for “owner occupation (secured finance) - purchase of other established dwellings”, aggregated quarterly and scaled to (seasonally adjusted) GDP, is shown in blue. It continues to trend upward but has still not reached its “GFC” minimum. The seasonally-adjusted value of lending for “investment housing - purchase for rent or resale by individuals”, similarly aggregated and scaled, is shown in purple — and continues to climb above its “GFC” minimum. First home buyers continue to be under-represented in spite of the recent increase in the FHB fraction, which presumably includes a pull-forward effect due to the termination of grants for purchases of established dwellings in Victoria, Tasmania and the ACT.
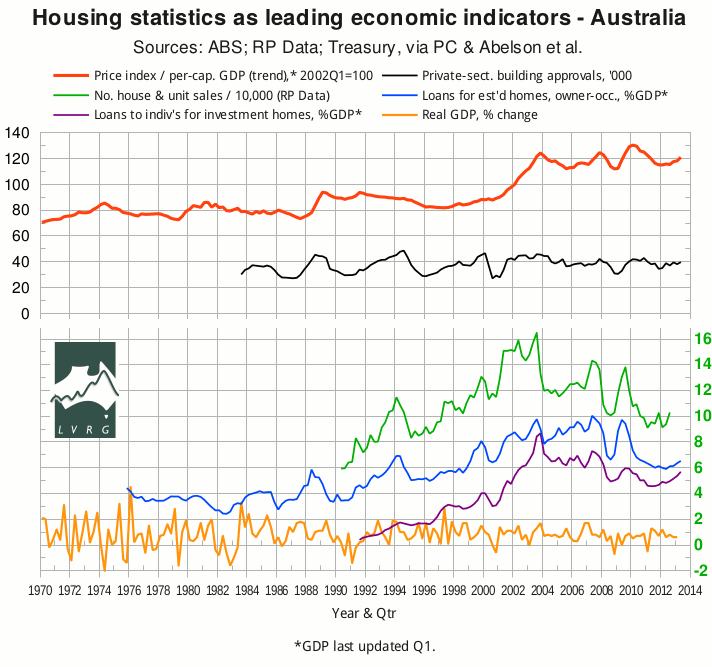
The black curve shows the seasonally-adjusted number of private-sector building approvals (ABS 8731.0).
In the second quarter of 2013, the Eight Capital Cities house-price index (ABS 6416.0) rose 2.4% in nominal terms, or about 2% in real terms. The red curve in the above graph shows the index scaled to per-capital GDP up to Q1 of 2013; but the change from Q1 to Q2 simply reflects the nominal change, because GDP has not been updated for Q2.*
Meanwhile, RP Data's 5-city daily dwelling-price index has just recorded its 7th consecutive weekly rise. So the latest cut in official interest rates (6 August 2013), unlike some previous cuts, does not coincide with any retreat in home prices.
Housing credit growth has lifted its head off the canvas; quarterly growth bottomed in August 2012, and annual growth reached its all-time (36-year) low in March 2013. Similar comments apply to new home sales, which bottomed in September 2012, although there is evidence that new house sales have fallen behind building approvals, commencements and completions, in spite of slow residential land sales and historically low dwelling construction rates.
In June, SQM's national residential vacancy rate rose to 2.2%, which is close to a post-GFC high.
SQM's national “Stock on Market” tightened from May to July 2013. But in the week ending August 4, RP Data's number of homes for sale was close to its all-time high, suggesting that SQM's trend will be reversed.
Loose monetary policy has rekindled exuberance among investors, leaving the market vulnerable to any blowout in the big banks' financing costs. But it has not produced a comparable exuberance among FHBs, on whom the Ponzi scheme ultimately feeds. Neither has it produced a commensurate recovery in residential construction, as it will need to if housing is to fill the employment void left by mining.
__________
* Sources for the top graph were given in the post of Nov.15.
