


Even in WA, recessions are announced by property crashes
Gavin R. Putland processes 34 years of monthly figures from Western Australia.
In the following graph (also available in high resolution), the blue curve (top) shows the rolling year-on-year change in the total value (“consideration”) of property transfers in Western Australia; the total for the last 12 months is adjusted for the corresponding 12-month rolling-average CPI in Perth (ABS 6401.0 Tables 1,2), and compared with the similarly-adjusted total for the second-last 12-month period. The black curve (bottom) shows the rolling year-on-year change in the total number of hours worked in WA (ABS 6202.0 Table 20; seasonally adjusted figures are used for want of an alternative, although seasonal adjustment is not needed for year-on-year comparisons). The red curve shows the 12-month rolling-average unemployment rate in WA (ABS 6202.0 Table 8, also seasonally adjusted).
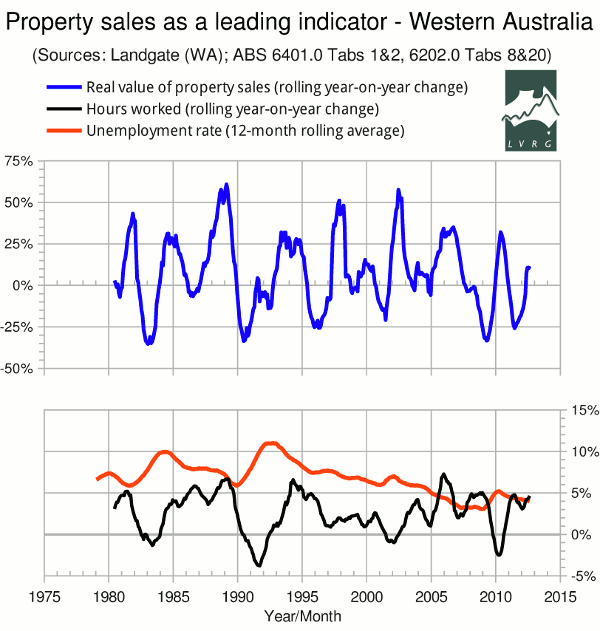
Labour-market figures are used as indicators of general economic health because the available figures for Gross State Product and State Final Demand do not cover the full period under study.
If we ignore “double dips” due to short-term fluctuations, the two lowest minima in the blue curve (change in property sales) correspond to recognized recessions. The third-lowest corresponds to the “global financial crisis”, in which a technical recession was averted (for the time being) by a hasty federal fiscal stimulus including the First Home Owners' Boost (FHOB).
The biggest year-on-year fall in property sales (35.3%) was recorded in January 1983. The O'Connor government in WA was defeated at the polls in February. The federal government led by Malcolm Fraser was defeated in March. The change in hours worked hit bottom in May '83, and the rolling-average unemployment rate peaked in June '84.
The second-biggest year-on-year fall in property sales (33.5%) was observed in June 1990, just as the corresponding change in hours worked turned negative. Thus began “the recession we had to have”. The change in hours worked hit bottom in September '91, and the rolling-average unemployment rate peaked in October '92. The Lawrence government in WA was defeated in February '93.
The third-biggest year-on-year fall in property sales (33.3%) occurred in April 2009. The corresponding change in hours worked reached a minimum, and the rolling-average unemployment rate reached a peak, in April 2010. Although the initial figures on State Final Demand indicated that WA was in a technical recession in the second half of 2010 (after the federal stimulus had run its course), this was not confirmed by the revised figures. Events in the labour market suggest that any recession was earlier: the “trend” aggregate monthly hours worked reached a minimum in August 2009 and then rose steadily until October 2010.
As the reaction to the FHOB ran out of momentum, the value of sales turned down again, recording its fourth-biggest year-on-year fall (25.8%) in June 2011. The year-on-year change in hours worked reached a minimum, albeit a healthy one (+3.1%), in January 2012. As I write, the 12-month rolling average ABS unemployment rate for WA is still falling, but the national Roy Morgan Unemployment Estimate continues its scary divergence from the ABS rate.
The fifth-biggest year-on-year fall in property sales (25.6%) occurred in April 1996. The rolling-average unemployment rate rose very slightly, peaking in December '96. The year-on-year change in hours worked fell to a moribund 0.87% in March '97.
The sixth-biggest year-on-year fall in property sales (20.9%) occurred in June 2001 — that is, on the completion of the first full year after the introduction of the GST. The rolling-average unemployment rate peaked in January 2002. The year-on-year change in hours worked reached a low of -1% in February 2002.
In summary, it has been Western Australia's experience that a large fall in property sales is a leading indicator of general economic contraction, and that a fall in the value of property sales of more than 30%, full year to full year, will precipitate a recession in the absence of timely stimulus. In 34 years, there has not been a recognized recession in WA without a 30% fall in the value of property sales, full year to full year.
Appendix A: Source of sales data
Late in September 1991, my predecessor Bryan Kavanagh wrote to the WA Valuer General's Office requesting information on the total number and value of property sales in WA. He was referred to Kerry Elder at the Office of Titles (now Landgate), who supplied him with the monthly aggregates from July 1978 to September 1991. A second instalment updated the series to August 1993. At this point Mr Kavanagh was placed on the monthly mailing list to receive the Business Activity Profile. After March 2000, the mailing list was discontinued in favour of a web page, which preserves monthly issues of the Business Activity Profile in PDF from February 1999 to the present, covering the months from July 1998 to the present.
While there were many changes in the content of the statistical report, one feature remained constant: a table of figures on monthly document lodgements, including a column headed “Transfers”, with two sub-columns headed “No.” and “Consideration”. This table was produced at least annually, with the financial-year total at the bottom of each column. From September 1991 at the latest, the table was produced monthly, showing figures for the financial year to date, with a running total at the bottom of each column. For each month up to June 1998, each column has three figures: the first is for initially “accepted” documents, from which the second (“rejects”) is subtracted, to obtain the third (“corrected”) figure, which is the one used in the above analysis. From July 1998 onward (that is, for the period covered by the PDF documents), only the corrected figures are given.
There were also many changes in the technology used to produce the statistical table. For 1978-9 to 1984-5, figures were handwritten on typewritten forms. For 1985-6, even the form was handwritten. For 1986-7 to 1989-90, figures were handwritten on stenciled forms bearing the instruction “Total documents accepted should agree with the daily lodgement tally as recorded by the computer.” From 1989-90 (again) to September 1991, the table was dot-matrix printed. After that, the table was professionally printed, but its production was evidently not completely automated. For example, in 1995-6 and 1997-8, the financial year was not updated until the January edition. Also in 1997-8, the running totals were not updated between November and February. In 1999-2000, the year was updated in August. There is also evidence of transcription errors (see Appendix B).
Mr Kavanagh was chiefly interested in the financial-year totals, which he combined with the corresponding totals from other States and Territories to produce his national “barometer of the economy”. The monthly resolution of the data from WA was not useful for this purpose, because some other jurisdictions could supply only annual figures. To produce the above graph for WA, however, I have digitized the 34 years of monthly “transfers”. The figures available in PDF files (1998-9 to the present) were copied and pasted into a text editor, manually converted to CSV format, and imported into a spreadsheet. Whenever the PDF figures could not be highlighted in neat rectangular blocks — i.e. often! — they were copied in a more or less jumbled order and had to be manually rearranged with the text editor. Earlier figures had to be manually transcribed into the spreadsheet. The annual totals were useful for checking the correctness of the editing and transcribing — and, as it turns out, for checking the internal consistency of the original figures.
Appendix B: Notes on data quality
B.1: Value of transfers
In the tables for 1994-5, the running totals from December onward are about $200 million lower than those calculated from the monthly figures. The error, which amounts to slightly less than 2% of the year's total, is almost certainly due to an incorrect calculation or transcription of the “corrected” value for December. When this value is recalculated from the initially “accepted” value and the ”rejects”, all the running totals agree. Accordingly, I have used the “recalculated” value for December. I infer that Landgate's running totals are correct and are calculated from the running totals of the initially “accepted” figures and the “rejects”, not by adding up the monthly “corrected” figures.
In the PDF files for May and June 2008, the value for May draws attention because it apparently uses dots instead of commas as thousands separators. Moreover, the value for May must be increased by $890,000 in order to match the published running totals for May and June. These observations are all consistent with a transcription error in May. Accordingly, I have used the “increased” value. But the issue is trivial because the discrepancy amounts to about 0.002% of the year's total.
In 2009-10, the PDF running totals for January and February are $2 million higher than those computed by the spreadsheet, but the PDF running totals for March, April and May agree with the spreadsheet. No single error can explain this. A single transcription error can explain why the PDF running total for June is about $70 million (i.e. less than 0.2%) higher than in the spreadsheet; but there is no way of telling whether the error is in the monthly transfer value or the total. For want of a better option, I have accepted the monthly values.
B.2: Number of transfers
Monthly numbers of transfers, although not shown in the above graph, were entered into the spreadsheet along with the “considerations”.
In the PDF files for 2008-9, the number for July is initially reported as 5495. In the December and later editions, the July number is increased to 5496, but the running total is still reported as if the July number were 5495 — provided that the number for December, reported as 6.164, is taken as 6,164. I have accepted 5495 for July and 6164 for December.*
In the PDF files for 2010-11, the number for September must be increased by 60 (i.e. about 1%) in order to reconcile the running totals from September to June. Inferring that the original September number is a transcription error, I have accepted the “increased” number.
The above discrepancies are minor and mostly correctable. I must compliment Landgate for its transparency, without which no member of the public would be able to detect, let alone correct, errors of this sort.
__________
* Paragraph modified Oct.8, 2012.
