


Home lending: Q1 trends are confirmed
And the price decline continued into Q1, says Gavin R. Putland.
In March 2012, according to ABS 5609.0, Table 1, series A2412509W, the total value of home lending excluding refinancing was $9.096 billion — the lowest since November 2008. But that had little effect on the following graph, in which the blue curve shows the seasonally-adjusted value of lending for “owner occupation (secured finance) - purchase of other established dwellings”, aggregated quarterly and scaled to GDP. The purple curve shows seasonally-adjusted lending for “investment housing - purchase for rent or resale by individuals”, similarly aggregated and scaled. Both scaled measures remain below their minima of Q3, 2008.
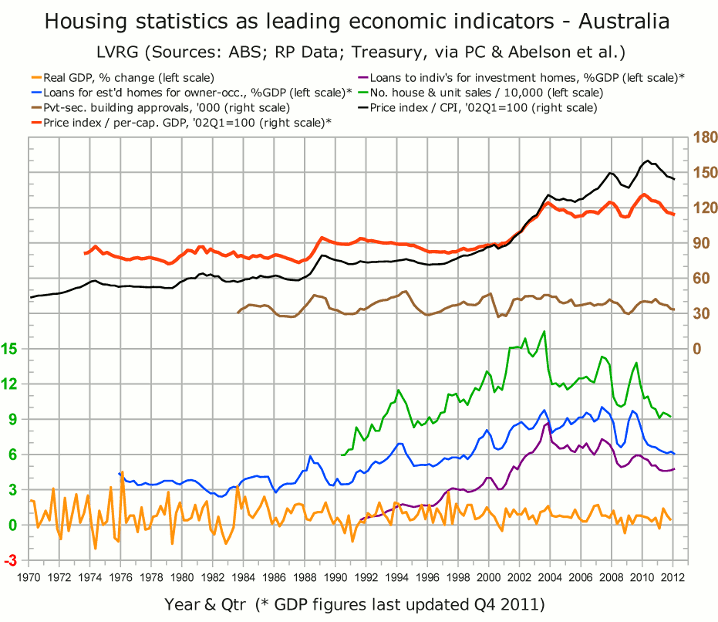
Meanwhile the Eight Capital Cities house-price index,* scaled to the CPI (black) or to per-capital GDP (red), continued its decline into the March quarter.
__________
* The sources for the home-price index are:
- 2002 Q1 onward (nominal): ABS 6416.0 Tables 1–6;
- 1986 Q2 to 2002 Q1 (nominal): ABS 6416.0 Table 10;
- 1970 Q1 to 1986 Q2 (real): BIS-Shrapnel, Real Estate Institute of Australia, ABS; consolidated by Treasury; forwarded via Productivity Commission; inflation-adjusted and graphed in Abelson, Joyeux, Milunovich & Chung, “House Prices in Australia - 1970 to 2003 - Facts and Explanations” (Research Paper 0504, Dept. of Economics, Macquarie University, 2005), Figure A1 (p.26);
- CPI: ABS 6401.0 Tables 1&2, series A2325846C;
- Per-capital-GDP (current prices, seasonally adjusted): ABS 5206.0 Table 1.
Sources for the other curves in the graph, in descending order, are as follows:
- Brown: Number of private-sector home-building approvals, seasonally adjusted (ABS 8731.0 Table 6, series A422006R, aggregated quarterly);
- Green: Number of house/unit sales (from monthly graphs published by RP Data, aggregated quarterly);
- Blue: Lending to buy established homes for owner-occupation, seasonally adjusted (ABS 5609.0 Table 11, series A2413062F, aggregated quarterly) relative to seasonally-adjusted GDP (ABS 5206.0 Table 1);
- Purple: Lending to individuals to buy investment homes (ABS 5609.0 Table 11, series A2413064K, aggregated quarterly) relative to seasonally-adjusted GDP (ABS 5206.0 Table 1);
- Yellow: “Headline” GDP — chain volume, seasonally adjusted, % change (ABS 5206.0 Table 1).
