


Fewer hours worked: lower GDP
Revised Feb.23, by Gavin R. Putland.
When January's healthy unemployment figures were reported on Macro Business, the first commenter noted a “fly in the ointment”: between December and January, in spite of the increased numbers of full-time and part-time employees and the lower unemployment rate, the total hours worked declined — by 1.4%.
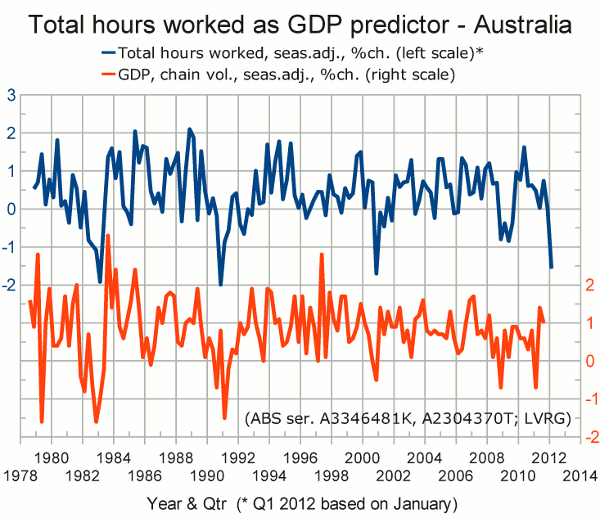
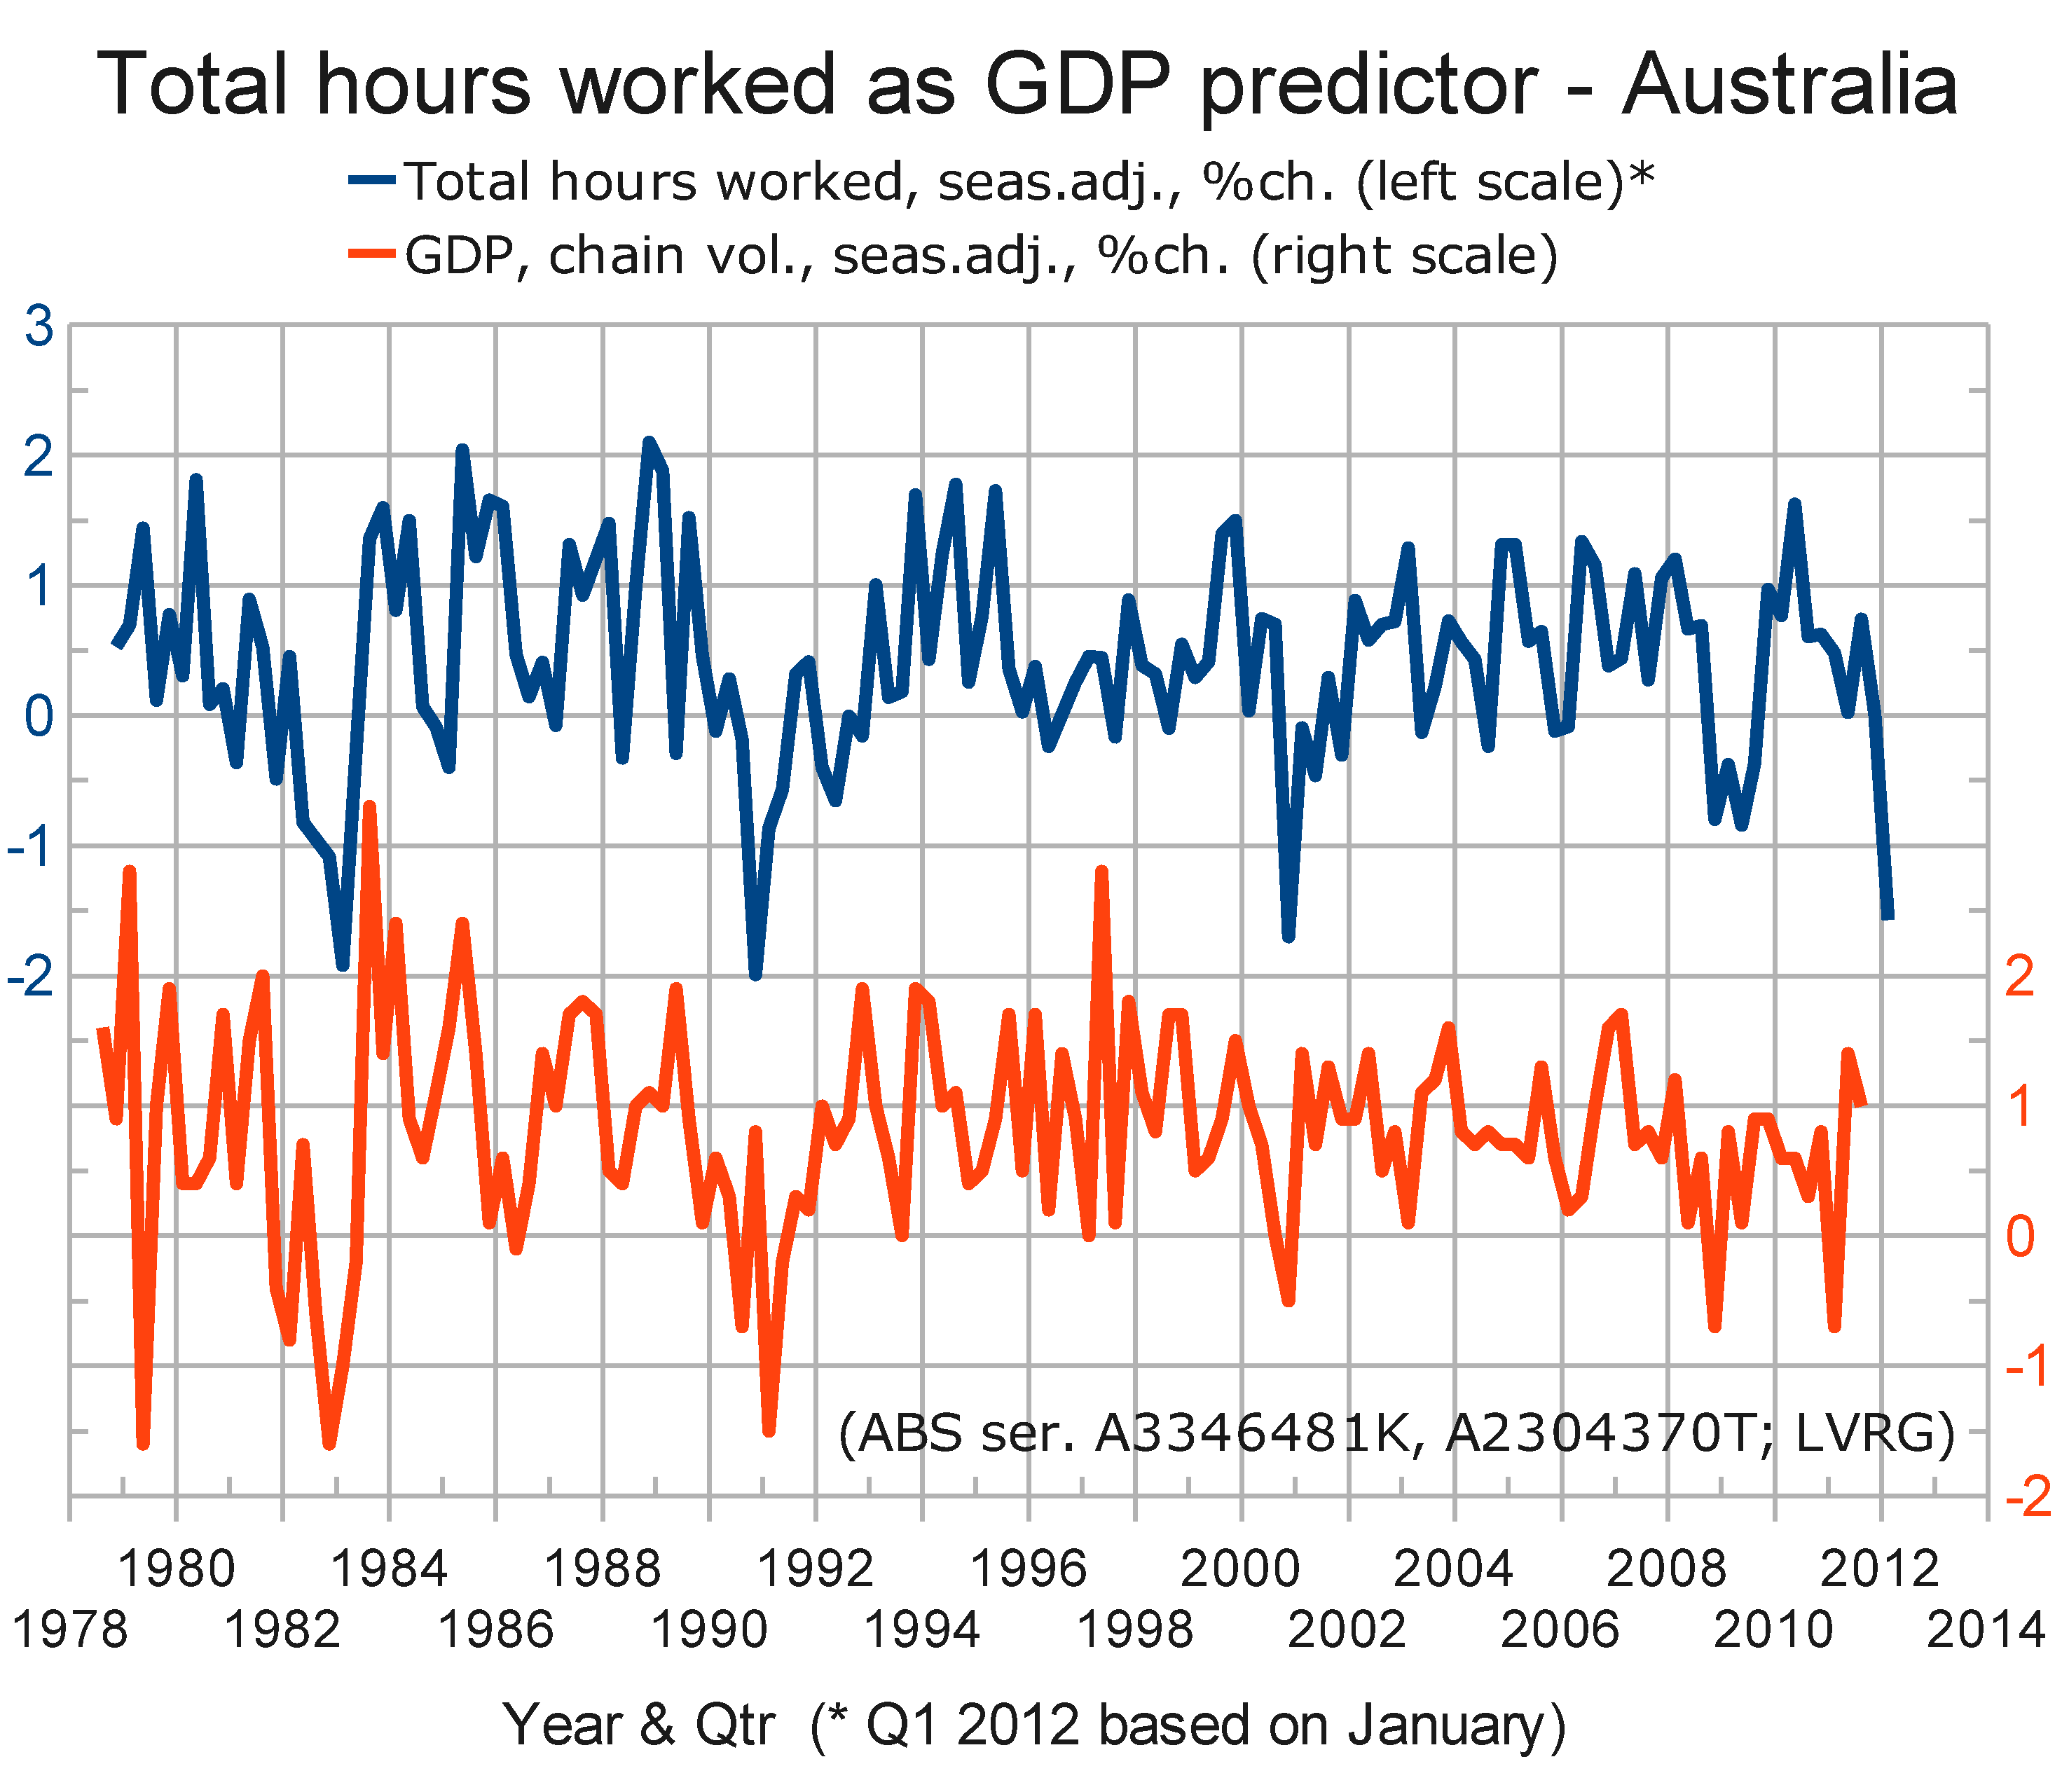
As we now know the total hours worked up to January but do not yet know GDP for the December quarter, I thought it would be instructive to look at the correlation between total hours worked and GDP. The following graph [hi-res version] shows the quarterly changes in total hours worked (blue) and real GDP (red). Hours worked are aggregated quarterly, and January's total (not the change since December) is assumed to be repeated in February and March. (Extrapolating the change since December would give a far more pessimistic projection.)
Because hours worked and GDP are both increasing in the long term, the correlation between them is bound to be strong regardless of any interposed leads or lags. The use of quarterly changes, rather than raw figures, avoids that source of bias.
The correlation between the change in aggregate hours worked and the change in GDP is found to be 0.346. It increases to 0.357 if GDP is delayed by one quarter, but falls to 0.26 if GDP is delayed two quarters. It falls to 0.18 if the aggregate of hours worked is delayed one quarter.
On those observations, the aggregate of hours worked is a simultaneous or slightly lagging indicator of GDP (not “leading”, as I wrote in the first version of this post). But if it lags by a month or less, it is still a “predictor” in the sense that the total of hours worked for the first month of each quarter is released before GDP for the previous quarter.
In search of a more precise measure of the lag, I decided to shift the total hours worked before aggregating quarterly, in order to allow shifting by any number of months (not necessarily a multiple of three months). I found that the cross correlation had multiple peaks, with one peak at the origin (that is, no time-shifting). Moreover, I found that if the timebase was shortened to exclude the GDP anomaly in the first half of 1979, the peak at the origin was highest (that is, the correlation was highest with no lag between GDP and hours worked).
Be that as it may, the history recorded in the graph shows that a large fall in total hours worked is a bad sign for GDP.
Last October, I gave another reason to expect a contraction in GDP in the current financial year.
