


Beneath the housing finance headlines
By Gavin R. Putland
Media coverage of the October housing finance figures has been bullish. But, as Macro Business explains, the picture changes if we exclude refinancing. If we also scale lending to GDP — for want of a better basis for intertemporal comparisons — we find ourselves plumbing sub-GFC depths. In the following graph,* seasonally-adjusted lending for “investment housing - purchase for rent or resale by individuals” (from Table 11), aggregated quarterly and scaled to GDP, is shown by the purple curve, while seasonally-adjusted lending to buyers of established homes for owner-occupation, similarly aggregated and scaled, is shown by the blue curve.
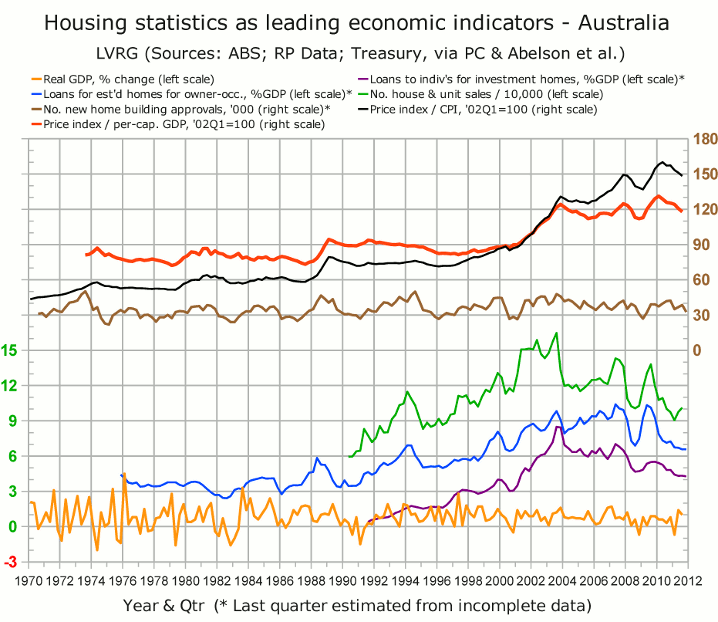
Note however that the plotted lending figures for Q4 of 2011 are based on October alone and therefore do not show any effect of the interest-rate cuts in November and December. The same caveat attaches to building approvals (shown in brown).
The house-price index scaled to per-capita GDP (red curve) has been revised to reflect releases and revisions of GDP figures up to the September quarter (yellow curve).
The green curve includes RP Data's house and unit sales up to September. Note that the recent bounce in the number of sales is not reflected in the total value of loans.
Meanwhile:
- In October, the RP Data-Rismark house price index (seasonally adjusted) fell for the 10th consecutive month.
- Construction work done rose by an impressive 12.5% (seasonally adjusted, by value) in the September quarter. But the rise was almost entirely due to engineering construction, which in turn was largely mining-related. Building rose only 0.6%, and the residential component declined 1.1%.
- In view of the surge in construction work done, it is puzzling that the AIG/HIA Performance of Construction Index for November was below 50 (indicating contraction) for the 18th consecutive month.
- After a slight recovery in August, new home sales resumed their slide below the “GFC” trough, falling 3.5% in the month to September, and 18% in the five months to September.
The strong growth in GDP for Q3 was accounted for by the leading mining States, Western Australia and Queensland, while the rest of the country stagnated in the wake of the housing slump.
__________
* Full sources for the graph were given on Oct.25.
