


Housing finance up, January prices down
Lending for housing recovered slightly in the December quarter as prices continued to slide, writes Gavin R. Putland.
In the following graph,* seasonally-adjusted lending for “investment housing - purchase for rent or resale by individuals” (from ABS 5609.0, Table 11), aggregated quarterly and scaled to GDP, is shown by the purple curve, while seasonally-adjusted lending to buyers of established homes for owner-occupation, similarly aggregated and scaled, is shown by the blue curve. Although both measures slightly recovered between Q3 and Q4, 2011, both were still below their “GFC” minima of Q3, 2008.
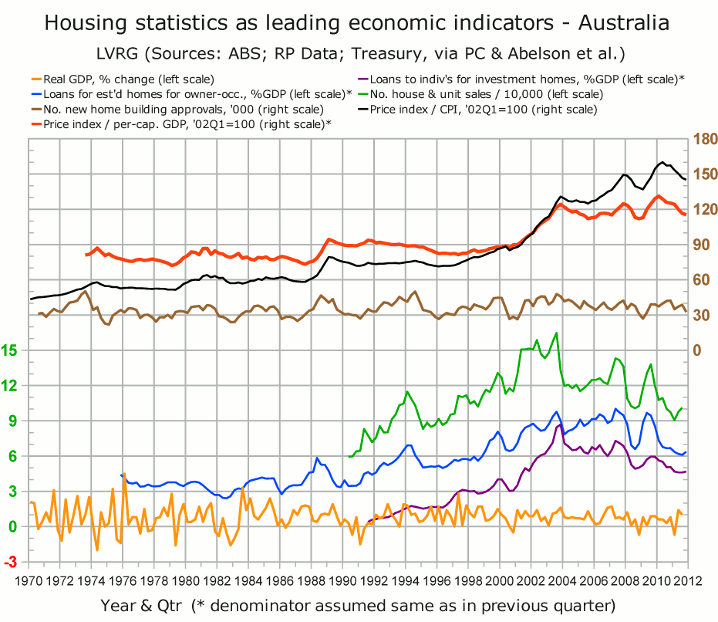
The recovery in lending shows the effects of interest-rate cuts in November and December, and the pull-forward of demand due to the termination of stamp-duty concessions for existing homes acquired by first-time buyers in NSW (announced in September, with effect at the end of December). Leith van Onselen at Macro Business has graphed the disaggregated figures to show how the recovery has been concentrated among first home buyers in NSW.
The green curve includes RP Data's house and unit sales up to September (and has not been updated since Dec.12).
The ABS house-price index scaled to the CPI or per-capita GDP (black and red curves, respectively) continued to decline in the December quarter. Residex's house-price index suggests that the price decline continued into January.
__________
* Full sources for the graph were given on Oct.25.
