


Hours worked rose in April
But GDP probably shrank in Q1, says Gavin R. Putland.
One good month does not a recovery make, but... According to ABS 6202.0, Tab.19, the total number of hours worked in April (seasonally adjusted) was 1.3% higher than the average of January to March, which itself was slightly healthier than previously reported, due to statistical revisions. (Leith van Onselen at MacroBusiness has further analysis of the April employment figures.)
In the following graph, the blue curve shows the quarterly total of hours worked, using April's figure to estimate the total for the current quarter. The yellow curve shows the contribution of the change in the balance of trade (ABS 5368.0 Tab.1) to the change in GDP. And the red curve (bottom) shows the quarterly “headline” change in GDP up to Q4 of 2011 (ABS 5206.0 Tab.1).
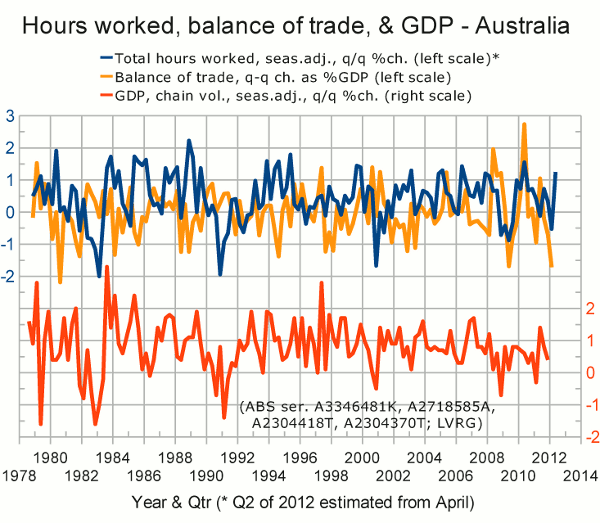
Notice that the change in the balance of trade will subtract 1.7 percentage points from the March-quarter change in GDP. That figure is all the more ominous because of the similarity between the trade curve and the GDP curve since Q3 of 2010. The influence of total hours worked in Q1 will be also negative, but smaller, and harder to quantify, although the correlation between contractions in GDP and large falls in hours worked is clear from the graph. The usual prelude to recession, namely falling property prices, is also in place.
I conclude that on the balance of probabilities, the March-quarter GDP print, to be released on June 6, will be a contraction.
