


Housing finance shows little change
By Gavin R. Putland
In the following graph,* the purple curve shows seasonally-adjusted lending for “investment housing - purchase for rent or resale by individuals” (from ABS 5609.0, Table 11), aggregated quarterly and scaled to GDP. The blue curve shows seasonally-adjusted lending to buyers of established homes for owner-occupation, similarly aggregated and scaled. If the values for Q1 of 2012 are estimated from January alone, we find that both measures continue their recent gradual upward trend, but are still below their minima of Q3, 2008.
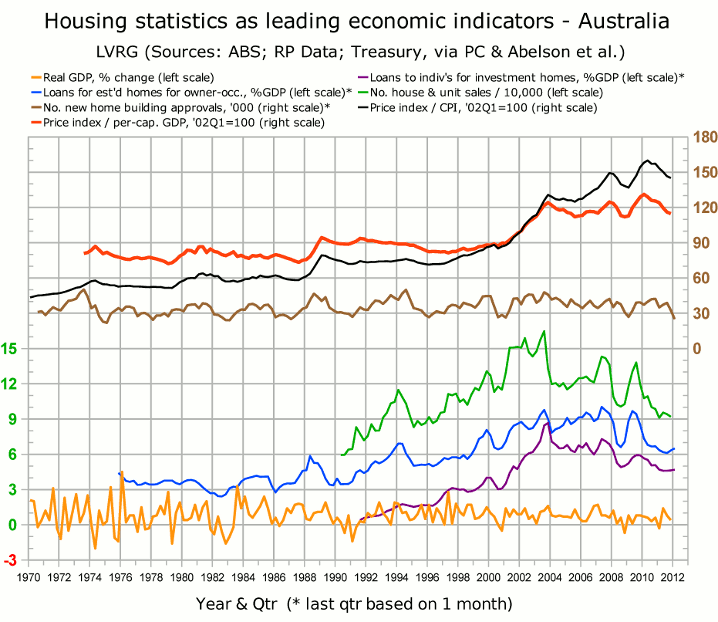
The green curve shows RP Data's house and unit sales up to December 2011, as reported at Property Observer. Figures for recent quarters have been revised. This is to be expected because, as RP Data says, “The most recent 8 months of sales are modelled based on historic levels of revision due to the time lag associated with receiving complete data sets.”
The apparent dip in building approvals (brown) should be treated with skepticism because it is based on January alone and is not seasonally adjusted.
On the lending figures alone, one might be tempted to call the bottom. Even if the recovery in lending is sustained, and even if it is demand-driven rather than supply driven, it takes time to run down the inventory of unsold housing and permit a recovery in prices. Neither of those conditions will be met if the housing slump spreads to the rest of the economy, as housing slumps usually do.
__________
* Full sources for the graph were given on Oct.25.
