


Employment figures give mixed signals on GDP
By Gavin R. Putland
Mainstream GDP forecasts underrate the effect of a falling housing market. Hence, when home sales and home prices have fallen, GDP is more likely to fall short of expectations than to exceed them. Australia's disappointing GDP for the December quarter conformed to that pattern. It was also unsurprising in view of the correlation between GDP and aggregate hours worked.
With thanks to the ABS, we can now update that aggregate. The following graph shows the quarterly changes in total hours worked (blue) and real GDP (red). Hours worked are aggregated quarterly, and the aggregate for Q1 of 2012 is estimated in the most optimistic possible way: by assuming that the upward trend from January to February is continued into March.
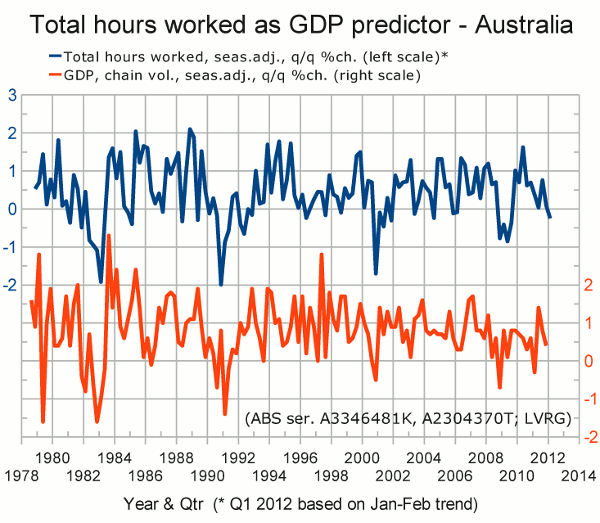
The result is a contraction in hours worked; but we've done worse without seeing a corresponding contraction in GDP.
If, instead, we estimate the hours worked in March by averaging January and February, we find that the contraction in hours worked was slightly worse than in Q4 of 2008 and Q2 of 2009.
We must conclude that the recent monthly totals of hours worked have been too volatile to permit a firm conclusion on quarterly GDP. The release of employment figures for March may clarify the situation.
