


Lending for owner-occupation turned down in February
But investment lending hardly changed, writes Gavin R. Putland.
In February, the seasonally-adjusted value of lending for “owner occupation (secured finance) - purchase of other established dwellings” (from ABS 5609.0, Table 11) recorded its lowest monthly result since October 2008. But if we aggregate it quarterly (estimating the March-quarter result by averaging January and February) and scale it to GDP, we get the blue curve in the following graph. The purple curve shows seasonally-adjusted lending for “investment housing - purchase for rent or resale by individuals”, similarly aggregated and scaled. Both scaled measures remain below their minima of Q3, 2008.
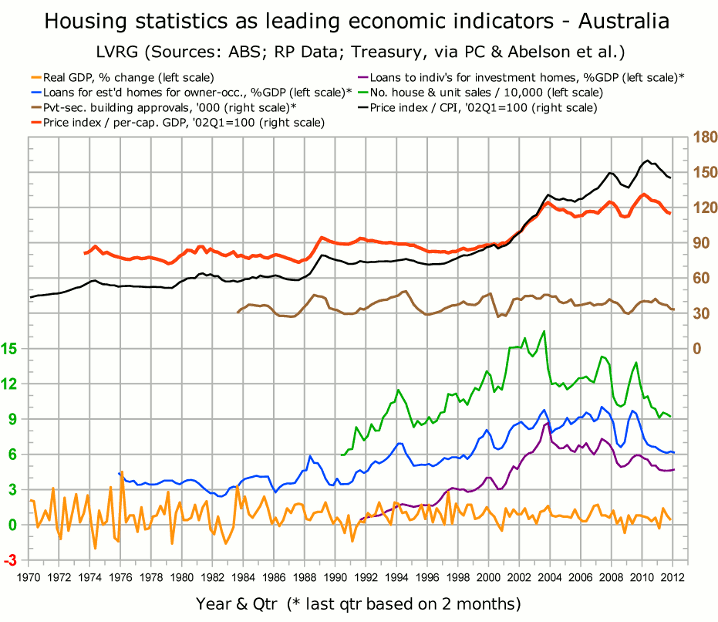
The green curve, showing RP Data's house and unit sales up to December 2011, has not been updated since my last post on this subject (Mar.13). But the brown curve, showing new home building approvals in the private sector, has been replaced with an updated seasonally-adjusted series (A422006R, from ABS 8731.0 Table 6). This covers a shorter period than the non-seasonally-adjusted series used in the Mar.13 post, but allows clearer timing of the turning points during that period.
Leith van Onselen at Macro Business has an article on how the lending figures were affected by the termination of stamp-duty concessions in NSW. He also notes that according to SQM Research, housing stock on the market rose in all capital cities in March.
Meanwhile Australian government bonds are showing an inverted yield curve for the next three years. In the Australian context that is not a convincing reason to expect recession. But there are others.
