


Falling stamp-duty receipts threaten more than revenue
By Gavin R. Putland
In Australia, according to ABS 5506.0 (Table 10), the fraction of revenue from “taxes on financial and capital transactions” contributed by “stamp duties on conveyances” ranged from 75.4% in 2001-2 to 91.5% in 2011-12, with a peak of 93.2% in 2008-9. But receipts from “taxes on financial and capital transactions”, unlike those from “stamp duties on conveyances”, are recorded in Table 18 of the National Accounts — over a longer time line, quarterly instead of annually. It is therefore reasonable to use “taxes on financial and capital transactions” as a long-timeline proxy for conveyancing stamp duty — as in the preceding post, which noted that recessions and financial crises have been preceded by steep falls in receipts from this category of taxes.
The correlation is perhaps clearer in the following graph, which shows the year-on-year change in the quarterly ratio of tax receipts to trend GDP, and the year-on-year change in chain-volume GDP (where tax receipts and chain-volume GDP are not seasonally adjusted, because the comparison is between corresponding seasons).
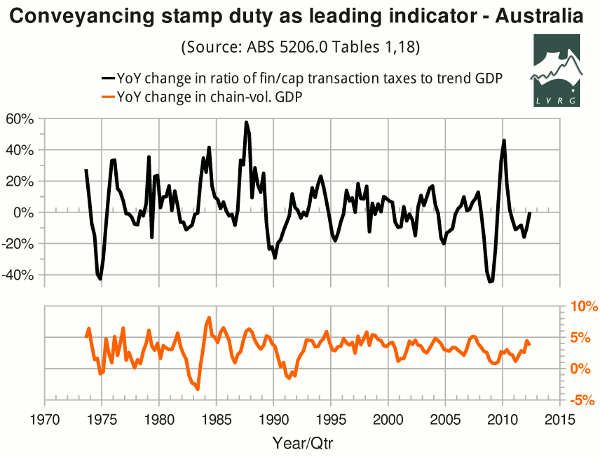
The graph shows three episodes in which tax receipts declined more than 25% year-on-year. The first two episodes announced the recessions of the mid '70s and the early '90s. The third was the “GFC”, in which Australia's property crash came later than elsewhere, allowing the Federal Government to stimulate in time to avert a technical recession (inflating a new housing bubble whose consequences are still being playing out). On the second and third occasions, the year-on-year change in tax receipts dipped below −25% before the first quarter of negative growth; on the first and second, the year-on-year change in tax receipts dipped below −25% before the year-on-year change in GDP turned negative.
Before the recession of the early '80s, the decline in tax receipts was much smaller. Interpreting such a small decline as a warning of recession would have produced numerous false alarms.
Was last year's decline in the “Kavanagh-Putland index” such a false alarm, requiring a revision of the threshold at which recession is predicted? Or will it only require a revision of the time frame to which the alarm applies? Or will revisions to the data indicate that the decline in the index was not as deep as first thought? I expect to have the answer to the third question by the end of October.
