


Kavanagh-Putland index inconclusive at this time
By Gavin R. Putland
Last year's update to the “Kavanagh-Putland index” (an estimate of the ratio of property sales to GDP) appeared to show that the year-on-year decline in the index was the third-biggest on record. According to the precedents, this indicated recession in 2011-12. Official statistics now indicate that there was no recession in that year; while the Roy Morgan unemployment rate rose about 2.5 percentage points during the year, to a recession-like 9.6%, the ABS unemployment rate rose only marginally, and GDP growth remained impressively robust. The Roy Morgan unemployment rate has since climbed to 10%.
For this year's update, we not only obtained the sales figures for 2011-12, but also engaged RP Data to supply a quarterly back-series for Victoria, starting in Q1 of 1975. Thus, whereas previous editions of the index had to make do with calendar-year totals for Victoria, we now have financial-year totals for Victoria from 1975-6 onwards, which can be added to the financial-year totals for other jurisdictions. The result is shown below.
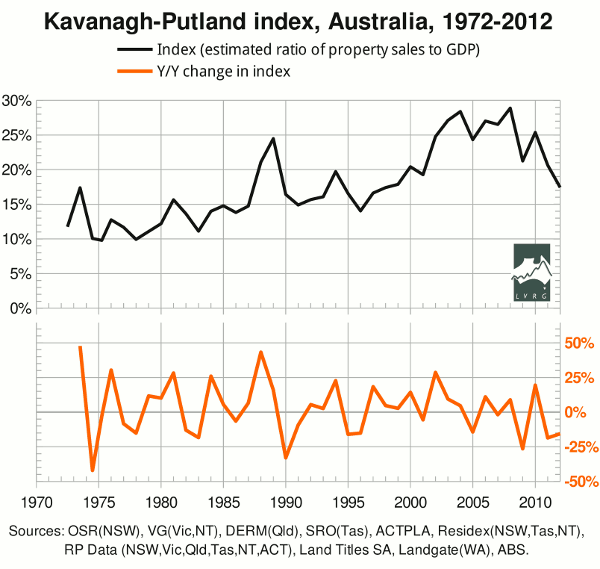
The biggest year-on-year declines are in calendar-year '74 (based on Victoria only) and the financial years ended '90, '09, '11, '83, '95, '12 and '78. Thus the fall of 2011 was the 4th-biggest, whereas the 1st-, 2nd-, 3th- and 5th-biggest were followed by, or coincided with, recessions or financial crises. Unless the recession apparently predicted last year is slightly late, there is no threshold that tells us whether there will or will not be a recession. If the “threshold” fall in the index is small enough to register the recession of '83, then 2011 was a false alarm or is yet to be confirmed. If, on the contrary, we exclude '83 on the ground that it is a “mid-cycle” recession, we do not have enough precedents to set a threshold. Furthermore, with only one data point per financial year, the fall of 2008-9 did not predict the “GFC”, but coincided with it.
The updates and revisions in the data increased the number of observed occasions on which it took two years for the index to fall from peak to trough. This suggested that it might be instructive to plot the two-year change in the index instead of the one-year change. The result is shown below.
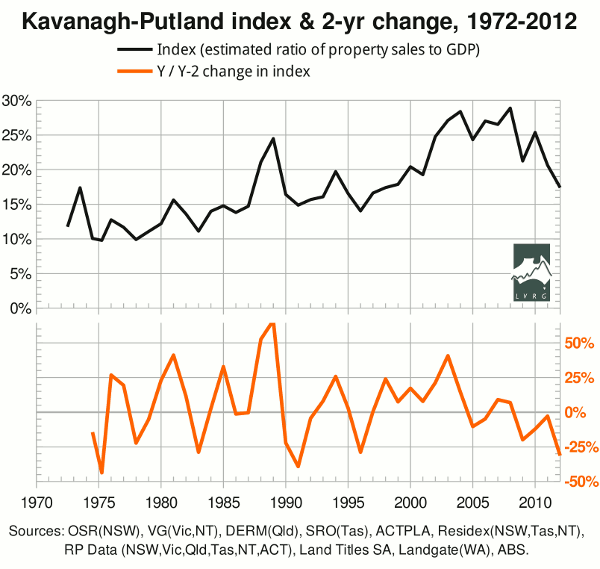
The biggest two-year declines are for '75 (based on half a year's data from Victoria) and the financial years ended '91, '12, '83, '96, '78 and '09. Thus the latest fall (to 2011-12) was the 3rd-biggest on record, whereas the 1st-, 2nd- and 4th-biggest were followed by, or coincided with, recognized recessions; and the fall of '09 (the “GFC”, not a technical recession) was smaller than that of '96 (not a recession). However, the falls of '83 and '96 were so similar that it would be ridiculous to claim any statistically significant difference between them. And if we cannot use '83 to set a threshold, we cannot tell whether such a threshold was breached in '12.
One might hope to resolve these ambiguities by improving the time-resolution from annual to quarterly for as much of the timeline as possible.
In the mean time, it is interesting that the index (top curve) has fallen not only below the “GFC” trough, but also below the peaks of 1994 and 2000. If one were to draw a horizontal post-1990 “bubble line” so as to classify the peak of '89 as a bubble, but not the peaks of '94* and 2000, then the index has fallen back below the bubble line. The same is true if the bubble line is drawn at Bryan Kavanagh's original level, namely 19%. Reversion below the bubble line was Kavanagh's original criterion of recession.
__________
* Corrected Nov.14, 2012.
