


Australian housing reaches unstable equilibrium
By Gavin R. Putland
The seasonally-adjusted value of lending for “investment housing - purchase for rent or resale by individuals”, aggregated quarterly and scaled to GDP (and shown by the purple curve in the following graph), is slightly higher than five quarters ago, but slightly lower than two quarters ago, and still below the “GFC” minimum.
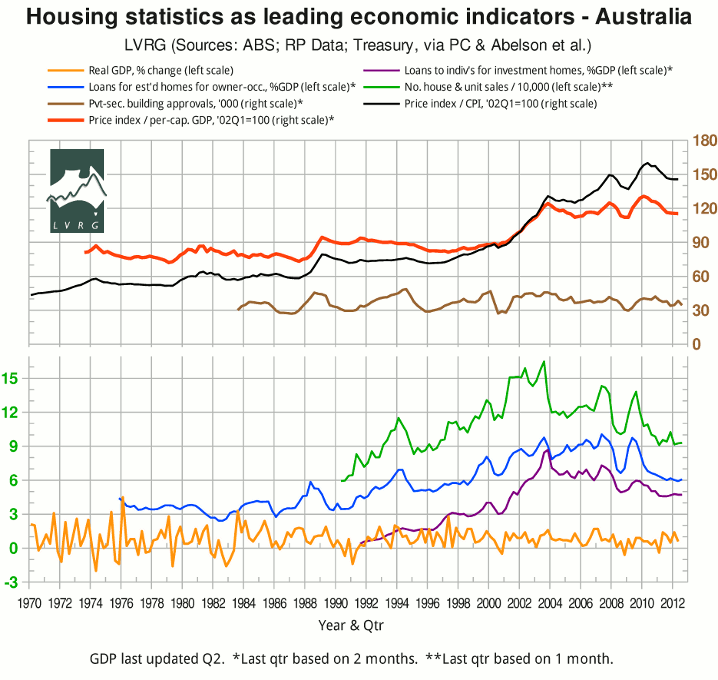
The seasonally-adjusted value of lending for “owner occupation (secured finance) - purchase of other established dwellings”, similarly aggregated and scaled (blue curve), is slightly lower than five quarters ago, but slightly higher than two quarters ago, and even further below its “GFC” minimum. Its decline from the last major peak (2009) is even worse than it was at the bottom of the GFC; but, because the last major peak was more than three years ago, and because the rate of decline over the last two years has been comparatively moderate, the year-on-year change has not returned to GFC-like depths.
The number of house and unit sales recorded by RP Data (green curve) is more volatile, perhaps because it is not seasonally adjusted, but otherwise tells a similar story to the blue curve. So far, whether we look at the quarterly graph (above) or the monthly graph, 2012 is looking much like 2011.
The Eight Capital Cities house-price index in real terms (black), or scaled to per-capital GDP (red), has flattened out. In nominal terms it rose slightly in Q2 of 2012. And a story in today's Property Observer has the startling implication that in half a dozen suburbs in western Sydney, the median gross rental yield might exceed the mortgage interest rate.
So the indicators of price and turnover in the housing market have approximately flatlined. Meanwhile, growth in GDP has been respectable for the last five quarters (yellow curve).*
It's enough to make a central banker boast of a Great Moderation. Except that the cash rate has been reduced by 1.5 percentage points over the past year, to a near-record low. That's what it takes to maintain the current sub-GFC pace of sales at current prices.
__________
* Full sources for the graph are given in the post of May 14.
