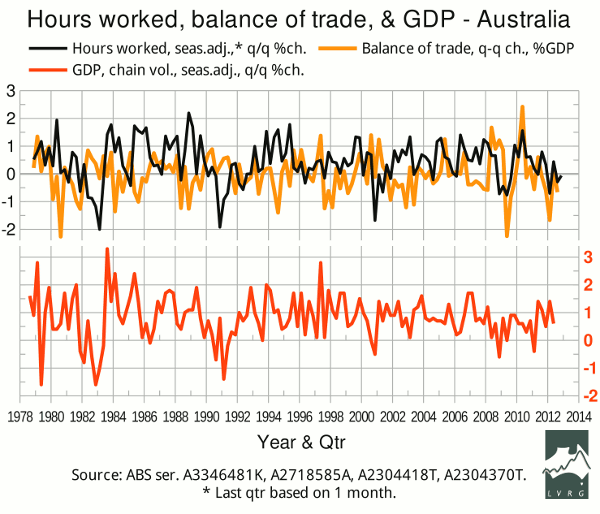
Hours worked and balance of trade show little change
By Gavin R. Putland
Since October 18, the quarterly total of hours worked (black curve) has been updated with October's figures (ABS 6202.0, Tab.19), and the contribution of the change in the balance on goods and services to the change in nominal GDP in the September quarter (yellow curve) has been completed with the release of September's figures (ABS 5368.0, Tab.1). The red curve (bottom) shows the quarterly “headline” change in GDP up to Q2 of 2012 (ABS 5206.0 Tab.1).

In terms of the implications for GDP growth in Q3 of 2012, the total of hours worked is almost neutral, while the balance on goods and services is negative, but not negative enough to make any prediction; and the graph has hardly changed.
The trade figures used for this graph are in current dollars. The corresponding chain-volume figures (ABS 5302.0, to be released on Dec.4) will be more meaningful for the “headline” GDP figure. Meanwhile the chain-volume retail sales (ABS 8501.0) fell an insignificant 0.1% in Q3.


