


Housing: Behold the supply-side crash
It's a crash, but not as we know it, writes Gavin R. Putland.
“This is the first weekend of the busiest four week period ever in the Melbourne residential auction market,” said Enzo Raimondo, CEO of the Real Estate Institute of Victoria, on Nov.21. The weekend of Nov.14 was also notably busy, as were the second and fourth of the five weekends in October. Meanwhile Australian Property Monitors report that clearance rates fell into the 50s in late October (Sydney) or early November (Melbourne).
Yet the bubble deniers — most recently Shane Oliver at AMP Capital — continue to cite a shortage of supply in support of inflated prices.
A typical housing crash, as I have said many times, begins on the demand side: sales fall first as buyers go on strike, and prices fall later (and more gradually) as sellers are forced to adjust their expectations. But no such adjustment should be needed when the fall in sales is due to a pre-announced event, such as the withdrawal of the First Home Owners' Boost (FHOB). Moreover, the timing of the peak in prices — May 2010 — seems too late to be explained by the withdrawal of the FHOB, but just right to be explained by the second-latest rise in official interest rates. Similarly, the latest downward step in clearance rates roughly coincides with the latest rise in interest rates.
But even current clearance rates are higher than one would expect in a context of flat or declining prices. So there's something else tending to push prices down. And as I hinted on Nov.11, I think it's on the supply side:
One possible explanation for the seemingly anomalous peaking of prices is that after so many bubble-bursts in so many countries, property owners have decided to get out while the getting is good.
The following graph has been updated to reflect ABS figures on GDP for the September quarter and housing finance for October.†
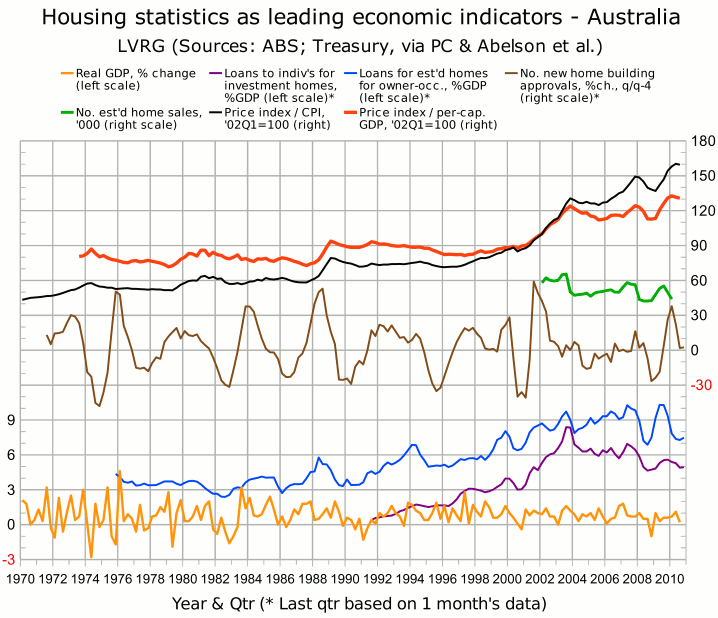
Lending to individuals for acquisition of investment homes (purple curve, second from bottom) and lending for acquisition of established homes for owner-occupation (blue, third from bottom) both recovered slightly in October. The continuing upward trend in weekly sales figures (not to be confused with clearance rates) suggests that November's lending figures will again show a rise. In contrast, RP Data-Rismark reports that prices in October, although slightly higher than in September, were still below the May peak. Since October, there has been another fall in action-clearance rates, which are correlated with price changes. The combination of rising volumes and declining prices can be explained by a supply-side rush.
The post of Nov.11 concluded:
But whatever the explanation, prospective buyers who observe the peaking or “flat-lining” of prices will conclude that this is not the time to buy. I would expect that realization to show up as a renewed slump in lending, for both owner-occupation and investment, in the near future. Then I would expect the usual sequence — a slump in sales followed by a slump in prices — to reassert itself with a vengeance.
__________
† The sources for the graph are listed in the endnotes to the post of Nov.11.
[“Typo” corrected Dec.21, 2010.]
