


Lending for housing investment at 17-month low
By Gavin R. Putland
In August, according to the Australian Bureau of Statistics, the seasonally-adjusted value of loans to individuals for investment homes (ABS 5609.0 Table 11, series A2413064K) slumped to its lowest level since March 2009. It was down 7.5% from the previous month's result, and 7.7% since the same time last year.
If those monthly loan values are aggregated quarterly and divided by GDP, the result is as shown by the purple curve (second from bottom) in the following graph. Loans to buyers of established homes for owner-occupation, similarly processed, are shown by the blue curve (third from bottom). Major downturns in both curves began in 1994, early 2000, late 2003 and late 2007, and each occasion gave at least one quarter's warning of a slump in home prices (top two curves).
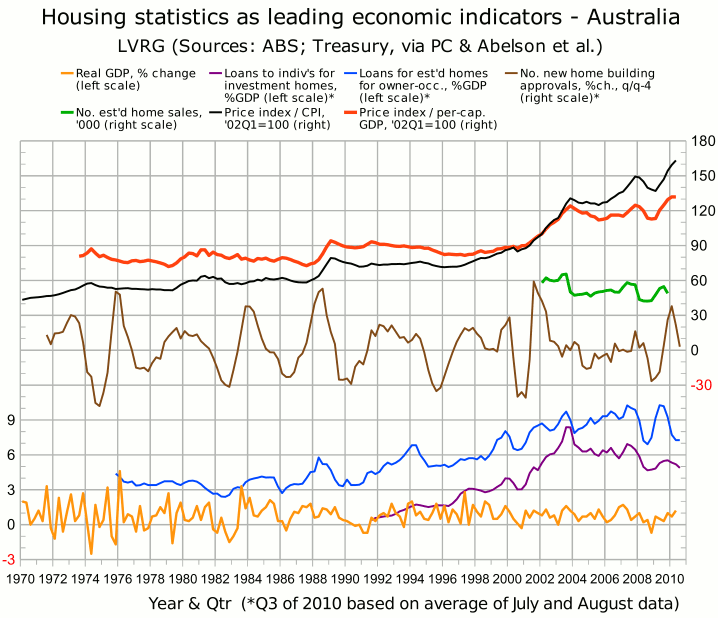
In the previous version of the graph,* in which the lending figures for the third quarter were estimated from one month's data, it seemed that lending for owner-occupation (blue) was in recovery after the plunge caused by withdrawal of the First Home Owners' Boost (FHOB), and that lending for investment (purple) had peaked. In the updated version (above), which estimates the third-quarter figures from the averages of the July and August figures, the “recovery” seems to be faltering and the downturn in investment lending is more pronounced. Had I estimated the third-quarter figures by extrapolating the July-August trend into September — or, equivalently (and reasonably!), by taking the middle month as representative of the quarter — both curves would now be headed downward, indicating an imminent decline in prices.
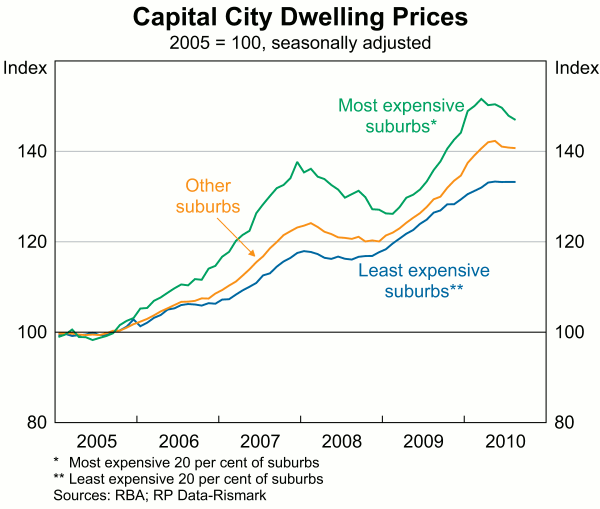
The price slump may have started earlier if the market did not fully “price in” the end of the FHOB and/or the return of interest rates to more normal levels. That is one possible interpretation of the following graph, which is based on figures from RP Data-Rismark and published as graph 61 in the RBA's Financial Stability Review for September 2010.
__________
* Detailed sources are given in the endnotes to the earlier post.
