


Price indices say housing has peaked
But the leading indicators are mixed, says Gavin R. Putland.
The average Australian housing investor is negatively geared. That is, the interest cost incurred by the average investor is not justified by rental income alone, but depends on capital gains as well. The “average” is taken over all investors, including those who own their properties outright and/or bought their properties for far less than their current values. Anyone contemplating paying current prices will need faster capital gains than the average investor. Unfortunately for the prospective sellers, and especially for recent buyers, those capital gains have stopped.
“Indeed, there has been no growth at all in capital city dwelling values since the end of May 2010,” wrote Christopher Joye on October 29. He added that “rest of state house values have realised no capital growth at all in 2010,” and claimed vindication for “our long-term projection that Australia's housing market would flat-line in the second half of 2010.”
Take a bow, Mr Joye. Now tell me: when buyers, who cannot justify the interest on current prices unless those prices are rising, see that prices have merely flat-lined in the second half of 2010, will they pay the same prices in 2011?
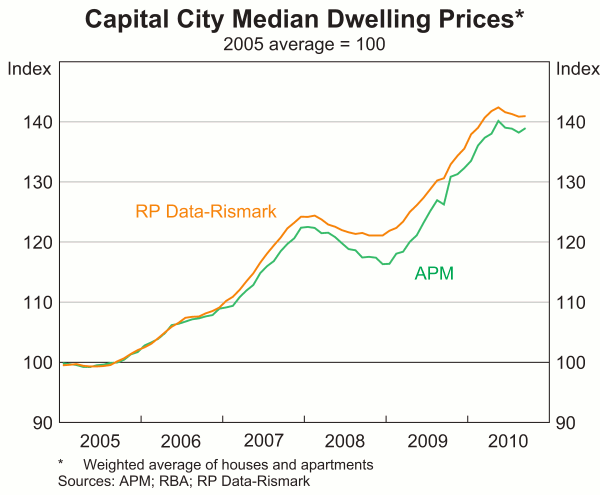
The flat-lining first announced by RP Data-Rismark (Mr Joye's firm) was subsequently confirmed by Australian Property Monitors. The results are compared in the following graph (published as graph 40 in the RBA's Statement on Monetary Policy for November 2010), which suggests that “flat-lining” doesn't quite tell the story:
Here's RP Data-Rismark's city-by-city breakdown (graph 41 in the same Statement on Monetary Policy):
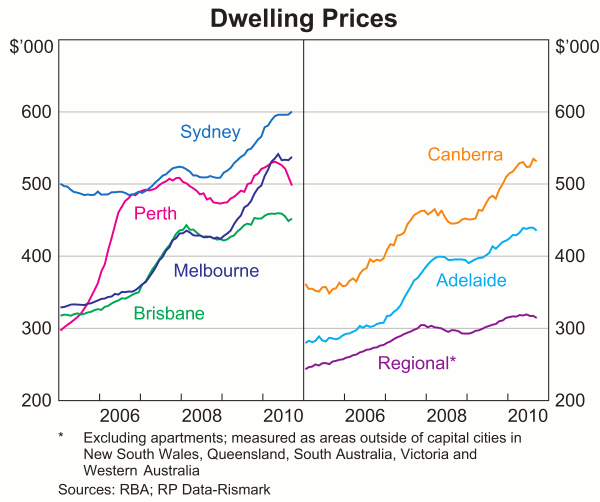
The second half of 2010 is looking much like the first half of 2008, isn't it? Except in Perth, where prices are falling faster. After the 2008 slump, it took the First Home Owners' Boost and a 425-point cut in interest rates to turn the market around. Now that the effect of those measures has been shown to be temporary, buyers won't so easily fall for the same trick again. Besides, this time the RBA won't have so much room to cut rates — not least because it will be acting alone, and not in concert with foreign central banks.
What then is to be done? I have suggested abolishing the GST in order to increase capacity to service loans, and replacing the revenue by extending capital gains tax to all assets at the full marginal rate, with no exemptions and no grandfathering. The latter step, by reducing the attractiveness of capital gains relative to current income, would tend to prevent a new speculative bubble. But it would not cause a one-off fall in prices, because the discouragement of buying (caused by the future CGT liability) would be offset by a discouragement of selling (due to realization of the current CGT liability). From the viewpoint of current owners — and their creditors — it's better to pay tax on a capital gain than to make a capital loss.
The monthly price indices from RP Data-Rismark and APM were confirmed by the ABS's quarterly index, which is used in the following graph [1,2], in which the red curve (the “scaled index”) shows a composite index of home prices scaled to per-capita GDP, while the black curve (the “real index”) shows the same composite index adjusted for the CPI only.
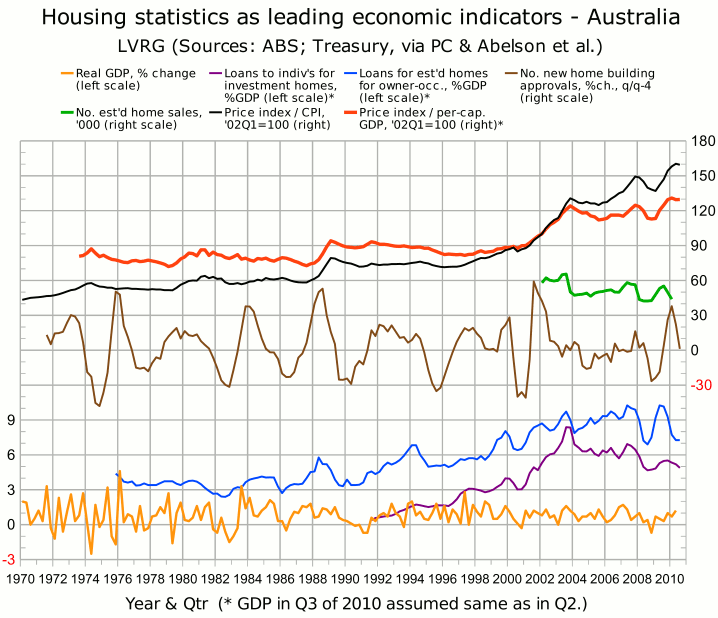
As announced last month, the scaled index yields an estimate of the overvaluation. The scaled index was almost stable from 1992 to 1994, when official interest rates were similar to today's, but is now about 45% above the “almost stable” level; that is, it must fall about 30% to return to that level.
In the above graph, the purple curve (second from bottom) shows lending to individuals for acquisition of investment homes (seasonally adjusted, aggregated quarterly, and divided by GDP), and the blue curve (third from bottom) shows lending for acquisition of established homes for owner-occupation (similarly processed). Clear downturns in both curves began in 1994, early 2000, late 2003 and late 2007, and each occasion gave at least one quarter's warning of a price decline.
In 2002, lending for owner-occupation (blue) fell substantially due to the phase-out of the $7000 Commonwealth Additional Grant (CAG), which was introduced in March 2001, reduced to $3000 at the end of 2001, and withdrawn at the end of June 2002. Lending for investment (purple) perhaps plateaued briefly, but did not fall. Prices kept rising, because the withdrawal of the grant and the consequent fall in sales were anticipated and “priced in”.
In late 2009, it seemed at first that a similar scenario was unfolding due to the phase-out of the FHOB (introduced in October 2008, halved at the end of September 2009, and terminated at the end of that year). But the latest figures show that the purple (investment) curve turned down, before prices peaked and lending for owner-occupation tentatively recovered from the post-FHOB slump.
By comparison with the precedents, the peak in real prices seems late in relation to the peak in the purple curve, and even later in relation to the peak in the blue curve. Furthermore, nationwide auction-clearance rates are still comfortably above 50%, whereas a “flat-lining” of prices would normally be accompanied by a clearance rate slightly below 50%. (Clearance rates are not really a “leading indicator” of price growth, as they are sometimes called; but they seem that way because they are published more promptly than price indices.)
One possible explanation for the seemingly anomalous peaking of prices is that after so many bubble-bursts in so many countries, property owners have decided to get out while the getting is good. That would be consistent with the sudden talk of a “glut” and the associated story about far more “For Sale” signs being put up than taken down.
But whatever the explanation, prospective buyers who observe the peaking or “flat-lining” of prices will conclude that this is not the time to buy. I would expect that realization to show up as a renewed slump in lending, for both owner-occupation and investment, in the near future. Then I would expect the usual sequence — a slump in sales followed by a slump in prices — to reassert itself with a vengeance.
Notes:
[1] Sources for the home-price index:
- 2002 Q1 onward (nominal): ABS 6416.0 Tables 1–6;
- 1986 Q2 to 2002 Q1 (nominal): ABS 6416.0 Table 10;
- 1970 Q1 to 1986 Q2 (real): BIS-Shrapnel, Real Estate Institute of Australia, ABS; consolidated by Treasury; forwarded via Productivity Commission; inflation-adjusted and graphed in Abelson, Joyeux, Milunovich & Chung, “House Prices in Australia - 1970 to 2003 - Facts and Explanations” (Research Paper 0504, Dept. of Economics, Macquarie University, 2005), Figure A1 (p.26).
[2] Other sources:
- Number of established home sales: ABS 6416.0 Tables 7,8;
- New home building approvals: ABS 8731.0 Table 11, series A418344C + series A419084L, aggregated quarterly;
- Lending for established homes for owner-occupation: ABS 5609.0 Table 11, series A2413062F;
- Lending to individuals for investment homes: ABS 5609.0 Table 11, series A2413064K;
- CPI: ABS 6401.0 Tables 1&2, series A2325846C;
- GDP and per-capita GDP (current prices, seasonally adjusted): ABS 5206.0 Table 1.
