Australian Housing: Beware the Ninth of March
The supply-side crash has apparently spread to the demand side, says Gavin R. Putland.
On 10 December I wrote:
Lending to individuals for acquisition of investment homes ... and lending for acquisition of established homes for owner-occupation ... both recovered slightly in October. The continuing upward trend in weekly sales figures (not to be confused with clearance rates) suggests that November's lending figures will again show a rise.
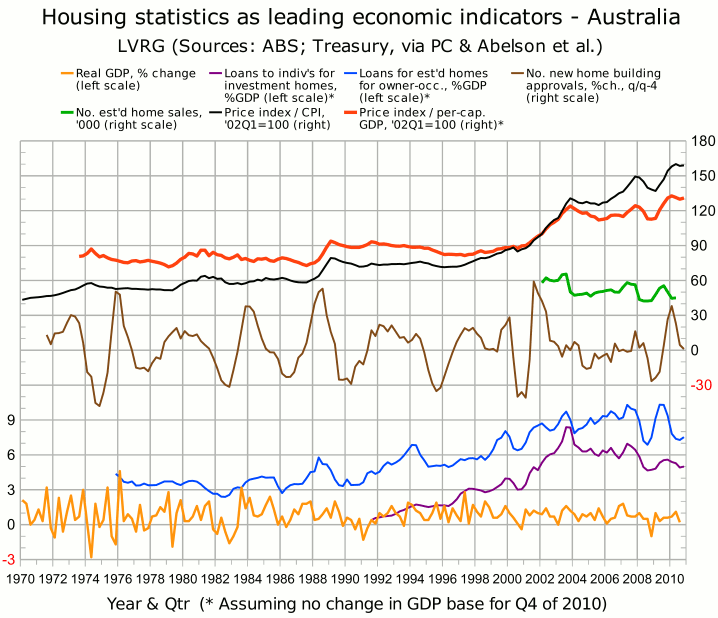
The suggestion was confirmed by some ABS measures but not by all. The “key figures” indeed showed a rise in November, and a larger rise in December. But the two series that I have been tracking declined by insignificant margins in November and rebounded in December. Those two series are aggregated quarterly in the following graph, in which the investment curve is second from the bottom (purple) and the owner-occupation curve is third from the bottom (blue).†

The upticks in the December quarter are clear, but may not be so clear when the graph is adjusted for that quarter's GDP figures, which will not be known until March 2.
Australian home prices peaked in May 2010. On October 29, Christopher Joye of RP Data-Rismark noted that “there has been no growth at all in capital city dwelling values since the end of May 2010,” and that “rest of state house values have realised no capital growth at all in 2010...” The peak was confirmed by Australian Property Monitors and graphed in the RBA's Statement on Monetary Policy for November 2010 (www.is.gd/KwHE2K). The top two curves in the above graph tell the same story.†
Hence, in my post of 11 November, I wrote:
Now tell me: when buyers, who cannot justify the interest on current prices unless those prices are rising, see that prices have merely flat-lined in the second half of 2010, will they pay the same prices in 2011?
The answer may lie in the announcement that AFG has recorded its biggest-ever fall in mortgage securitizations between December and January (www.sejz6.tk). In every State, the fall exceeded the previous national record. But that didn't stop the CEO of AFG from trying to blame the Queensland floods.
My post of Nov.11 went on to say:
One possible explanation for the seemingly anomalous peaking of prices is that after so many bubble-bursts in so many countries, property owners have decided to get out while the getting is good...
Property listings have been consistent with that theory. Commenting after the auctions of 20–21 November, the CEO of the Real Estate Institute of Victoria noted that:
This is the first weekend of the busiest four week period ever in the Melbourne residential auction market.
In a press release dated 31 January, RP Data's director of research said:
Leading up to Christmas the number of homes being advertised for sale ramped up very quickly with the capital city markets peaking at just under 127,000 listed properties compared with 89,000 homes for sale at the same time the previous year. Auction clearance rates were hovering slightly below 50 per cent at the end of last year, and average selling times and vendor discounting had both been trending in favour of buyers.
My post of Nov.11 concluded:
But whatever the explanation, prospective buyers who observe the peaking or “flat-lining” of prices will conclude that this is not the time to buy. I would expect that realization to show up as a renewed slump in lending, for both owner-occupation and investment, in the near future. Then I would expect the usual sequence — a slump in sales followed by a slump in prices — to reassert itself with a vengeance.
Will the slump in securitizations be reflected in the ABS housing finance figures for January? We'll find out on March 9. If that is indeed the long-anticipated slump in sales, the ensuing price crash should be evident by the second quarter.
__________
† The sources for the graph are listed in the endnotes to the post of Nov.11.


