


Kavanagh-Putland index rises on Sydney investment binge
By Gavin R. Putland
Last year's release of the ‘Kavanagh-Putland index’ showed that the ratio of property sales to GDP was slightly higher in 2012-13 than in 2011-12. The RBA lowered the cash rate by 25 points in May 2013 and again in August 2013. Since then, lending for acquisitions of owner-occupied homes and investment homes, especially the latter, has continued to rise in proportion to GDP. The investment frenzy has been led by New South Wales, where the investors' share of finance commitments (excluding refinancing) has smashed through the record set in 2003-4, yielding an unexpected stamp-duty bonanza for the state government.
“If you can't beat them...”
Curiously, NSW also led the charge in terminating first home owners' grants for established homes. Unfortunately the Commonwealth made no matching reforms to negative gearing, with the result that first home buyers (FHBs) found it even harder to compete with investors in the market for established homes — unless, of course, they decided to make their first home an investment home, using negative gearing to service larger mortgages than they could carry as owner-occupants.
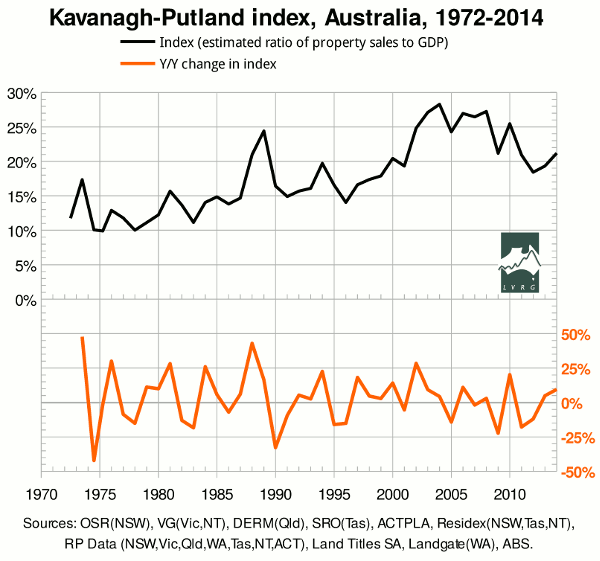
Hence I am not surprised to report that the K-P index rose again in 2013-4. The first graph shows the index and the year-on-year change therein:
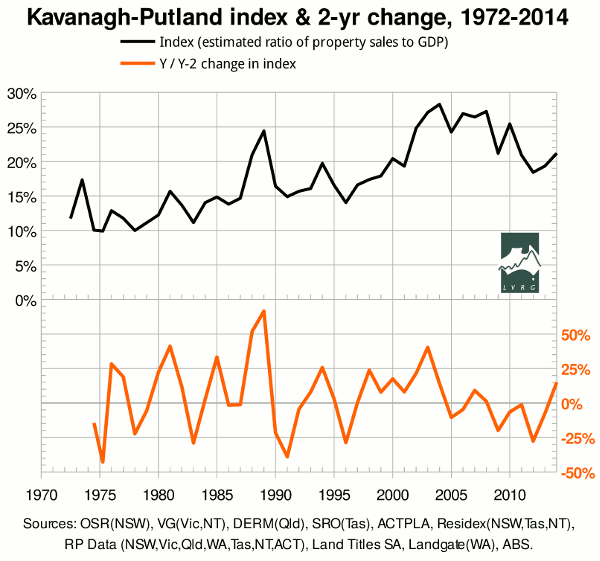
For interest's sake, the second graph shows the index and the two-year change therein:
“What gets measured, gets managed.”
As previously noted, the year-on-year change in the K-P index was a reasonably good predictor of Australian recessions prior to the massive policy interventions of 2008-9 (a fall of more than 18% signalled a recession). Since then, governments and central banks have paid closer attention to the housing market. Policy interventions designed to influence that market invalidate predictions about its internal dynamics, while interventions designed to counteract the influence of that market on the wider economy reduce its value as an economic indicator.
The critical question is how long the authorities can keep the music going. On interest rates, David Llewellyn-Smith has remarked: “The RBA is in the process of throwing away its ammunition and when the next crisis strikes the chamber will be empty.” His graph of investor mortgage commitments suggests the trend cannot continue for long, even under the most favourable conditions, before investors pull in their horns as in 2003-4. Under less favourable conditions, investors are more willing than owner-occupants to stop buying or rush for the exits. That makes the present market unusually vulnerable to the mining investment “cliff” or any external shock.
Technical Notes and Acknowledgments
The K-P index is an estimate of the ratio of property sales to GDP. It is called an “index”, rather than a simple “ratio”, because it is based on a varying sample.
Only Victoria has sales figures dating back to 1972. Qld, WA and NT join the sample in 1979, Tasmania and the ACT in '84, SA in '85, and NSW in '89. Initially, Bryan Kavanagh obtained figures from government offices. But, as more and more governments monetized their data, more and more figures had to be obtained from secondary sources. There were cases in which the figure for a particular jurisdiction in a particular year was rejected as unreliable, e.g. because it was an outlier or had been subject to an unusually large “correction”. More recently, using figures from RP Data, we plugged the gaps from 2001-2 onward.
To deal with missing or rejected sales figures, we add up the property sales in those jurisdictions for which reliable figures are available, and divide by the estimated sum of Gross State Products (GSPs) in the same jurisdictions, so that jurisdictions without reliable figures are simply excluded from the sample.
I say “estimated sum” because the GSP figures from the ABS are also incomplete; they go back only as far as 1984-5 and are released later than the corresponding GDP figures. Furthermore, due to an apparent change in methodology, GSPs do not add up to GDP before 1989-90. Accordingly, for each year in which GSPs are known, the GSP for each jurisdiction is divided by the total GSP to obtain the “GSP fraction”, which is then multiplied by GDP to obtain the “estimated GSP” for that jurisdiction. For earlier/later years, the earliest/latest available GSP fractions are used. The extrapolations of GSP fractions affect the index in those years for which the sales figures are incomplete. In the current release, the estimated GSPs for 2013-4 are based on the GSP fractions for 2012-13; but this does not affect the index because the sales figures are complete.
A further problem is that the figures from Victoria's Valuer-General were for the calendar year while annual figures for other jurisdictions were for the “financial year ended...” RP Data was able to supply quarterly figures for Victoria, but only from 1975 onward. Thus the first three data points on each graph are for calendar years, and the fourth is for the first half of calendar year 1975, and the rest are for financial years. We use seasonally adjusted GDP figures to ensure that the result for the single half-year is not affected by the seasonal variation in GDP, although it is still affected by any seasonal variation in sales.
We continue to use RP Data's figures for Victoria. In the above graphs, we also use RP Data's figures for 2011-12 onward in NSW, Qld, Tas, NT and ACT, for April 2013 onward in WA, for 2007-8 in NSW, and for 2009-10 in Tas. Excluded from the sample are NSW in 2000-1 (which fortunately is not a critical year for interpreting the graphs), NT in 1997-8 (for which the geographic coverage does not match other years), and ACT in 1991-2. Obviously the last two exclusions make little difference to the calculated index.
