Housing: Are we maxed out again?
By Gavin R. Putland
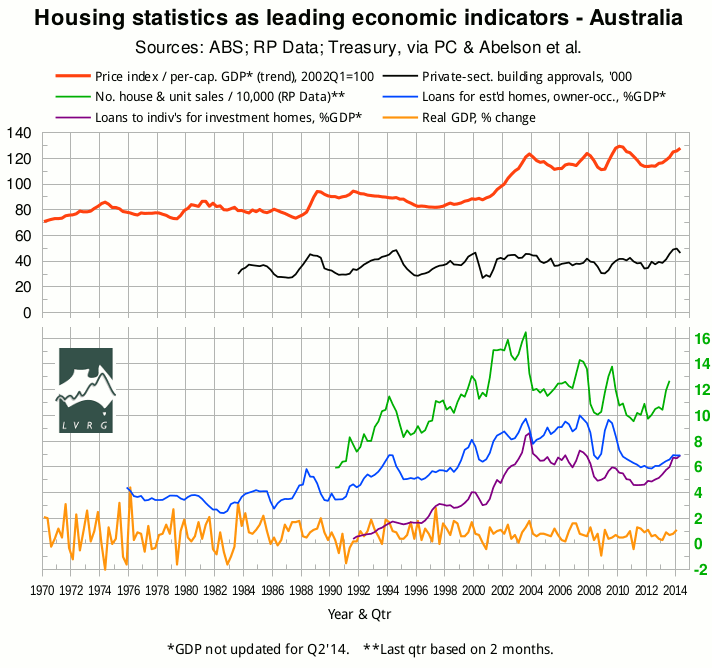
The ABS Eight Capital Cities house-price index for the June quarter of 2014 was released today (12 August). The index has been scaled to per-capita GDP and plotted in red (top curve) in the following graph.† The curve continues to rise, but at a somewhat reduced rate. The last data point does not yet reflect the change in GDP from Q1 to Q2.

On 8 August, the ABS released housing-finance figures for June 2014 (ABS 5609.0). In the graph, the seasonally-adjusted value of lending for “owner occupation (secured finance) - purchase of other established dwellings”, aggregated quarterly and scaled to seasonally-adjusted GDP, is shown in blue. The seasonally-adjusted value of lending for “investment housing - purchase for rent or resale by individuals”, similarly aggregated and scaled, is shown in purple. The owner-occupation curve has plateaued just above its “GFC” minimum. The investment curve, although its upward trend has been checked, has just peeped above the owner-occupation curve for the first time ever. The closest thing to a precedent was in Q4 of 2003, when lending for owner-occupation had already turned down. Investment lending soon did likewise. The fraction of loans going to first home buyers was then, and is now, historically low.
The apparent resistance to the growth in lending coincides with a downturn in the seasonally-adjusted number of private-sector building approvals (black curve, from ABS 8731.0), but does not yet show in the year-on-year housing credit growth as recorded by the RBA (click “Credit Growth by Sector”).
Supply-side indicators are mixed. New home sales, according to the HIA, peaked about three months after building approvals; but the number of loan approvals for construction or acquisition of new homes continues to rise. SQM's national rental vacancy rate shows a gradual upward trend with seasonal fluctuation; but SQM's national stock-on-market graph shows little but seasonality. The HIA's median residential lot price, which had been flat, turned upward in mid 2013, and the volume of sales fell. For this, the HIA blames the failure of governments to release land into or within developers' land banks, although the figures actually refer to the release of land by developers, out of their land banks.
House prices have reached their present heights under the influence of 200bp of cuts in the RBA's cash rate, beginning in November 2011. The sizes of the associated mortgages imply a “neutral” rate below 3.5%. The current rate is 2.5%. What would an “emergency low” look like? As David Llewellyn-Smith puts it, “The RBA is in the process of throwing away its ammunition and when the next crisis strikes the chamber will be empty.”
__________
† The sources for the home-price index are:
- 2002 Q1 onward (nominal): ABS 6416.0 Table 2;
- 1986 Q2 to 2002 Q1 (nominal): ABS 6416.0 Table 10;
- 1970 Q1 to 1986 Q2 (real): BIS-Shrapnel, Real Estate Institute of Australia, ABS; consolidated by Treasury; forwarded via Productivity Commission; inflation-adjusted and graphed in Abelson, Joyeux, Milunovich & Chung, “House Prices in Australia - 1970 to 2003 - Facts and Explanations” (Research Paper 0504, Dept. of Economics, Macquarie University, 2005), Figure A1 (p.26);
- CPI: ABS 6401.0 Tables 1&2, series A2325846C;
- Per-capital-GDP (current prices, trend): ABS 5206.0 Table 1. The trend figures from the ABS start in Q3 of 1973, but the unsmoothed (“original”) figures go back further. Accordingly, the available trend figures are extrapolated backward in one-year linear segments, replicating the year-on-year percentage changes in the unsmoothed figures. The earliest linear segment is extended back another half-year. Thus the timing of the 1974 peak in the red curve is not in doubt, but shape of the preceding upswing is less certain.
Sources for the other curves, in descending order, are as follows:
- Number of private-sector home-building approvals, seasonally adjusted (black): ABS 8731.0 Table 6, series A422006R, aggregated quarterly;
- Number of house/unit sales (green): RP Data (various releases), aggregated quarterly;
- Lending to buy established homes for owner-occupation, seasonally adjusted (blue): ABS 5609.0 Table 11, series A2413062F, aggregated quarterly, divided by seasonally-adjusted GDP in current dollars (ABS 5206.0 Table 1);
- Lending to individuals to buy investment homes (purple): ABS 5609.0 Table 11, series A2413064K, aggregated quarterly, divided by seasonally-adjusted GDP in current dollars (as above);
- “Headline” GDP — chain volume, seasonally adjusted, % change (yellow): ABS 5206.0 Table 1.


