


Lies, damned lies and marginal tax rates
De-obfuscating the rise in the tax-free threshold — by Gavin R. Putland
If governments would collect their necessary revenue in the form of site rents, resource rents, monopoly rents and licence rents — all of which, by reason of their origin, accrue preferentially to the rich — they would not find it necessary to impose “progressive” taxes on earned income. Hence they would not face the following dilemma: If you want to give an income-tax cut to people on low incomes but not to those on higher incomes, you need to increase the marginal rate on incomes in between, in which case your political opponents — or rather your fellow income-taxers who masquerade as your political opponents — will accuse you of wanting to raise taxes on people whose incomes are “in between”, although in fact these people will pay less tax than before.
The problem is perhaps best explained by a real-life example. The Australian government, by way of compensation for imposing a price on carbon, wanted to give a tax cut to individuals earning between $16k and $80k (per annum), but not to those earning more. It could not give a tax cut to those earning less than $16k, because they already paid no tax. In the following graph of annual income tax as a function of annual income, the black curve is for 2010-11 (before the change) while the red curve is for 2012-13 (after the change).*
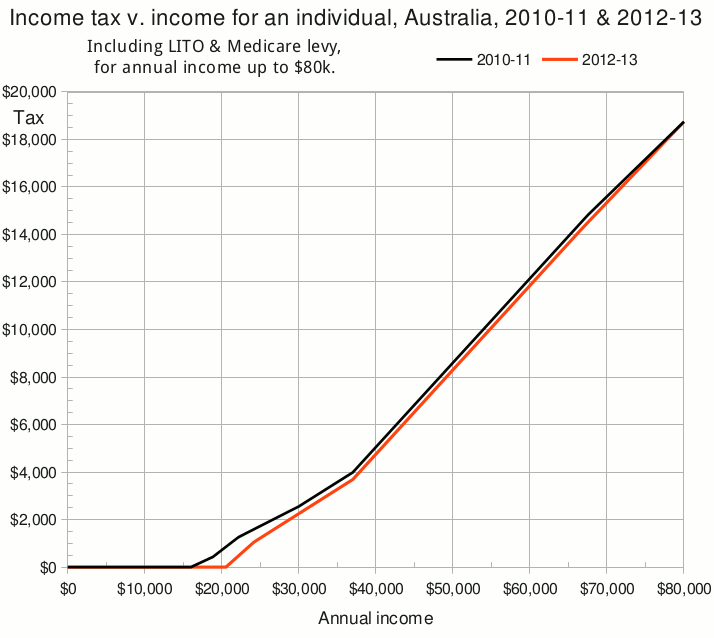
For incomes between $16k and $80k, the red curve is below the black curve, indicating tax cuts. To confine the cuts to those earning less than $80k, the two curves must meet at an income of $80k.† Therefore there must be a certain income threshold above which the red curve is steeper than the black curve but still below the black curve — that is, a threshold above which taxpayers in 2012-13 face a higher marginal tax rate than before, but still pay less tax than before. That threshold happens to be $67,500.
But that is not the only income range over which the red curve is lower but steeper. The other is from $20,542 to $30k; and the difference in slope over that range is not uniform.
Why are the shapes so complicated? Most of the answer lies in politicians' efforts to disguise the fact that a tax cut over a limited income range requires an increase in the marginal rate over part of that range. In particular:
- The Low-Income Tax Offset (LITO) is an income-tax rebate for low income earners. The rebate is non-refundable, meaning that it is not allowed to exceed the tax otherwise payable. It is “withdrawn” at a certain rate (the taper rate) for income in excess of a certain threshold; that is, it is reduced by so many cents per dollar of income over the threshold. Hence, at a certain higher threshold (the cutoff), the rebate is reduced to zero. The LITO is equivalent to a tax cut for incomes below the cutoff, and its withdrawal is equivalent to an increase in the marginal rate between the threshold and the cutoff. Thus the LITO achieves nothing that could not be achieved by adjusting the statutory income-tax rates and thresholds — except to hide the increase in the marginal rate!
- The Medicare levy is a second income tax at a standard rate of 1.5% (ostensibly for the purpose of funding Medicare, although it only covers about half the cost). If your income is below the so-called “lower threshold”, you are exempt from the levy. For income in excess of the threshold, the exemption is “withdrawn” at 10 cents in the dollar. This “withdrawal” is equivalent to a marginal rate of 10% until your income reaches the so-called “upper threshold”, which is the threshold at which the exemption is fully ”withdrawn” and the levy reaches 1.5% of your total income. If the lower threshold is denoted by L and the upper threshold by U, we have
0.1 (U-L) = 0.015 U ,
so thatU = L / 0.85 .
Thus the “levy” with its “exemption” and “withdrawal” achieves nothing that could not be achieved by adjusting the statutory income-tax scales, except to hide two facts: (i) it's a tax hike, and (ii) between the thresholds, it raises the marginal tax rate by 10 percentage points!
For 2010-11, according to the “Clean Energy Future” tax-reform page, the statutory income-tax rates were 15% for incomes from $6k to $37k, and 30% for incomes from $37k to $80k, but the LITO raised the effective tax-free threshold to $16k.‡ The LITO was $1500 withdrawn at 4% for income over $30k, giving a cutoff of $67,500. For 2010-11, according to the Tax Forum Discussion Paper of 28 July 2011 (p.9), the lower threshold for the Medicare levy was
L = $18,839.
So the marginal tax rates for 2010-11 were
0 to $16k:            0.0%
$16k to L:           15.0%  (bottom statutory rate)
L to L/0.85:         25.0%  (Medicare ramps up at 10%)
L/0.85 to $30k:      16.5%  (Medicare drops from 10% to 1.5%)
$30k to $37k:        20.5%  (LITO withdrawn at 4%)
$37k to $67,500:     35.5%  (statutory rate jumps 15ppt)
$67,500 to $80k:     31.5%  (LITO gone).
These figures, and the amounts of tax computed therefrom, agree with those given by John Humphries, 10 July 2011, Table 1. (But his Table 2 fails to allow for any indexation or change in the lower Medicare threshold.)
For 2012-13, according to the “Clean Energy Future” tax-reform page, the statutory income-tax rates are 19% for incomes from $18,200 to $37k, and 32.5% for incomes from $37k to $80k (statutory rates for incomes over $80k did not change), but the LITO raises the effective tax-free threshold to $20,542.‡ The LITO was $445 withdrawn at 1.5% for income over $37k, giving a cutoff of $66,666.67. For 2012-13, according to the ministerial press release of 8 May 2012, the lower threshold for the Medicare levy rose to
L = $20,542 ,
matching the new effective tax-free threshold. So the marginal tax rates for 2012-13 were
0 to L:               0.0%
L to L/0.85:         29.0%  (bottom statutory rate + Medicare at 10%)
L/0.85 to $37k:      20.5%  (Medicare drops from 10% to 1.5%)
$37k to $66,666.67:  35.5%  (LITO withdrawn at 1.5%; stat.rate jumps 13.5ppt)
$66,666.67 to $80k:  34.0%  (LITO gone).
These rates agree with those given by John Humphries, 25 June 2012.
The two sets of marginal rates were used to compute the above graph of tax v. income. They are shown directly in the following graph, which appears on p.10 of the Tax Forum Discussion Paper. The relevant curves are “Total EMTR 2010-11” and “Total EMTR 2012-13”.
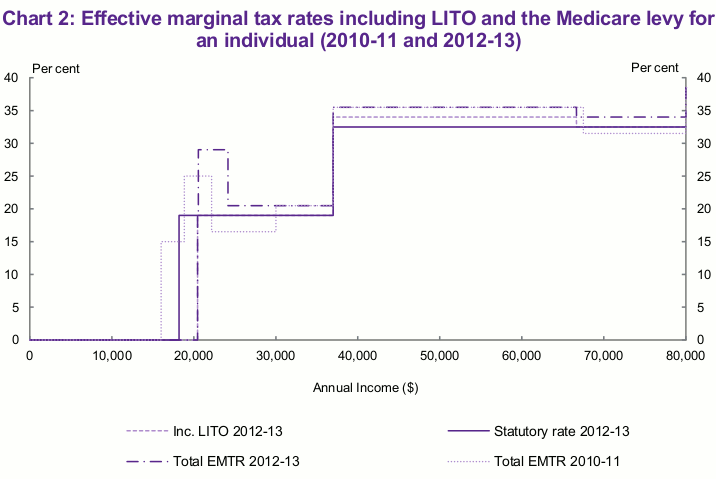
The term “effective marginal tax rate” (“EMTR”) normally refers to the combined effect of income tax and withdrawal of welfare. In this context, however, we include no welfare payments, but only taxes and non-refundable tax offsets. I therefore submit that the word “effective” is redundant.
The Tax Forum Discussion Paper acknowledges (p.9) that because of the LITO and the Medicare levy, the real marginal rates can be higher than the statutory rates. Then it adds:
The personal tax reforms announced in the Clean Energy Future package address some of these issues by raising the tax free threshold, adjusting some statutory rates, and cutting the withdrawal rate of LITO by 2.5 cents in the dollar. These reforms make the tax scales more transparent and reduce reliance on the LITO to deliver tax relief.
That's unduly flattering. Making the scales “transparent” requires the abolition of the LITO and the Medicare levy. I concede, however, that the decision to increase some marginal rates — and even two statutory rates — was, as the fictitious Sir Humphrey would say, “courageous”. It has been seized upon by those who find it convenient to focus on marginal rates rather than the actual tax paid.
But, to return to my opening point, the surest way to put an end to numerical jiggery-pokery with income-tax rates is to get rid of taxes on income per se — preferably in favour of collecting economic rents.
__________
* 2011-12 is omitted because the tax scales were affected by temporary disaster-relief measures.
† Actually the curves don't quite meet; those earning more than $80k received a tax cut worth a princely $3 (per annum).
‡ The effective tax-free thresholds are quoted from the tax-reform page but may be calculated as follows. Let income E be taxed at a bottom marginal rate R above a threshold T, and let the full value of the LITO be V. Then the effective tax-free threshold is where the LITO exactly balances the tax otherwise payable, i.e. where R(E-T) = V. Solving for E gives E = T + V/R, if this is within the bracket at which the bottom rate applies (which it is).
[Last modified Mar.11, 2013.]
