


The last flight of the bullhawks
GDP bounced but housing didn't, writes Gavin R. Putland.‡
The July housing finance figures were released by the ABS on Sep.6. Seasonally-adjusted lending for “investment housing - purchase for rent or resale by individuals” (from Table 11), aggregated quarterly and scaled to GDP, is shown by the purple curve in the following graph.* Seasonally-adjusted lending to buyers of established homes for owner-occupation, similarly aggregated and scaled, is shown by the blue curve.
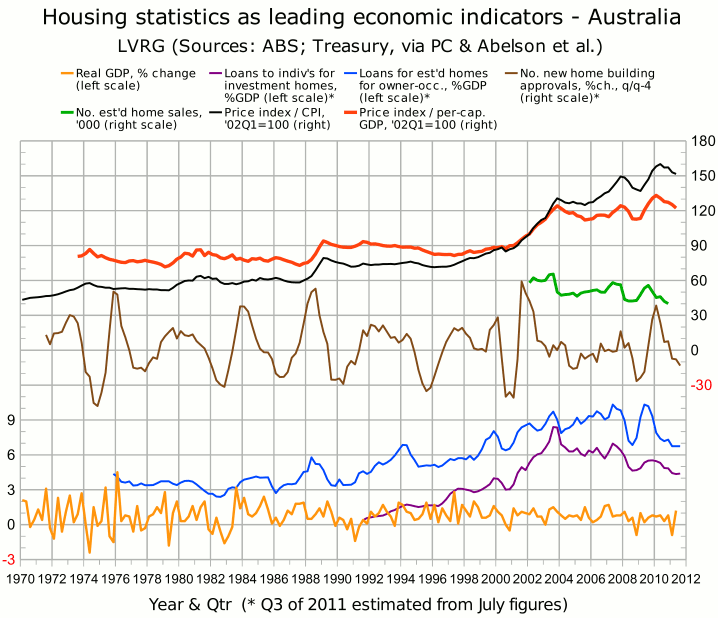
Last month, I reported that the former curve was “imperceptibly higher” in Q2 than in Q1, but still below the “GFC” minimum (Q3 of 2008), while the latter curve was below the “GFC” minimum in Q1 but slightly above in Q2. But the scaling to GDP was done on the assumption that GDP for Q2 was the same as for Q1. When the latest GDP figures are used, we find that in Q2, the former lending curve (investment) was at its lowest point since Q1 of 2001, and that the latter lending curve (owner-occupation) has flattened out at its lowest level since Q4 of 2000. Both curves, as estimated from the July lending figures, are still below their “GFC” minima.
According to the ABS, total construction work done in the June quarter was slightly higher than in the March quarter, but the rise was entirely due to the engineering component; the residential building component was down 4.1% (seasonally adjusted) since the March quarter, and down 7.6% since the corresponding quarter last year. Building approvals were up slightly in July, but the private housing component continued its downward trend. In August, the AIG/HIA Performance of Construction Index was below 50 (indicating contraction) for the 15th consecutive month. All sectors of the industry suffered falls in activity.
New home sales, which fell 8.7% (seasonally adjusted) in June, fell a further 8% in July, to a level below the “GFC” trough.
Also in July, the RP Data-Rismark house price index (seasonally adjusted) fell for the 7th consecutive month.
Because GDP in Q1 was so low, it was not difficult for GDP in Q2 to look healthy by comparison. Even so, GDP for Q2 surprised most commentators (especially this one) on the upside, largely because of an unexpectedly high contribution from final consumption expenditure (which is not fully captured in “retail trade” figures). That “good” news rules out any fiscal stimulus in what remains of Q3, and makes it harder for the central bank to cut interest rates in the near future. These effects in turn are bearish for housing, and for the economy in general, in Q4.
__________
‡ Last modified Sep.13, 2011.
* Sources for the graph are given in the notes to the Nov.11 post.
