


Owner-occupation lending bounced; investment lending didn't
By Gavin R. Putland
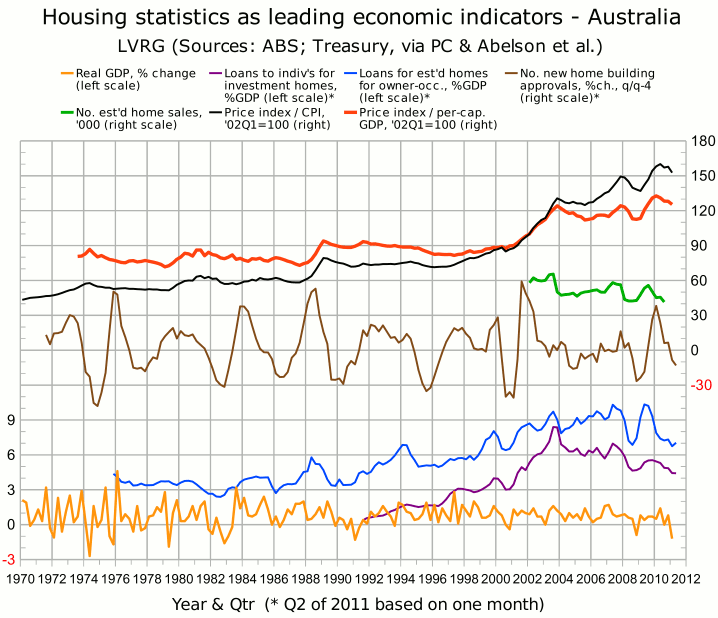
In April 2011, according to the Australian Bureau of Statistics (ABS 5609.0, Table 11), lending to buyers of established homes for owner-occupation, in proportion to GDP, rose above the “GFC” trough. But lending to individuals to buy investment homes, also in proportion to GDP, slid to a new ten-year low, equaling the quarterly result for Q2 of 2001. The contrast can be seen in the blue and purple curves in the following graph.*
The headline figure on investment lending — a fall of 1.6% by value, seasonally adjusted — was mostly explained by lower lending to corporate entities; lending to individuals was only marginally below the mean for the preceding three months.
By most other seasonally-adjusted metrics, lending recovered in April. In particular, the total number of loans for owner-occupation, the subtotal excluding refinancing, and the number for acquisition of established homes for owner-occupation, all set 10-year lows in March but bounced back in April (ABS 5609.0, Table 1).
The rise in lending in April contrasts with bleak news on construction and retailing. As the Murdoch press reported yesterday, “Australia's construction industry has shrunk for the 12th consecutive month... All four sub-sectors contracted in May, with a significant fall in apartment building... [T]he apartment sub-sector has recorded 13 months in a row in negative territory.” Meanwhile the retail industry, squeezed by high household debt and falling asset values, is headed for its lowest year-on-year growth for 20 years.
So why was there a bounce in lending? Commenting at Macro Business (on a post that seems to have been deleted), Nathan Webb offered a tentative explanation: “I'd guess that the seasonally adjusted numbers don't take into account Easter and Anzac day coming back-to-back... This time around the Anzac day long-weekend was engulfed by Easter, so in effect, there was an extra weekend for house-hunting compared to 2009 and 2010.”
In any case, the volatility of monthly statistics is one reason why the figures in the above graph are aggregated quarterly even if they are available monthly. One-off influences on the April lending figures should be diluted or compensated as later figures are added to the aggregates for the second quarter.
__________
* Sources for the graph are given in the notes to the Nov.11 post.
