


Home lending and sales at mini-recession levels
But the market is now only 40% overvalued, writes Gavin R. Putland.
The ABS “housing finance” figures for March 2011 (Table 11) confirm that in proportion to GDP, lending to buy established homes for owner-occupation (the blue curve in the following graph) is the lowest since Q4 of 2000 (a “mini-recession” quarter, in which the economy contracted 0.4%), while lending to individuals to buy investment homes (the purple curve) is the lowest since Q2 of 2001 (the upswing from the post-GST slump). Each curve has a minimum in Q3 of 2000.
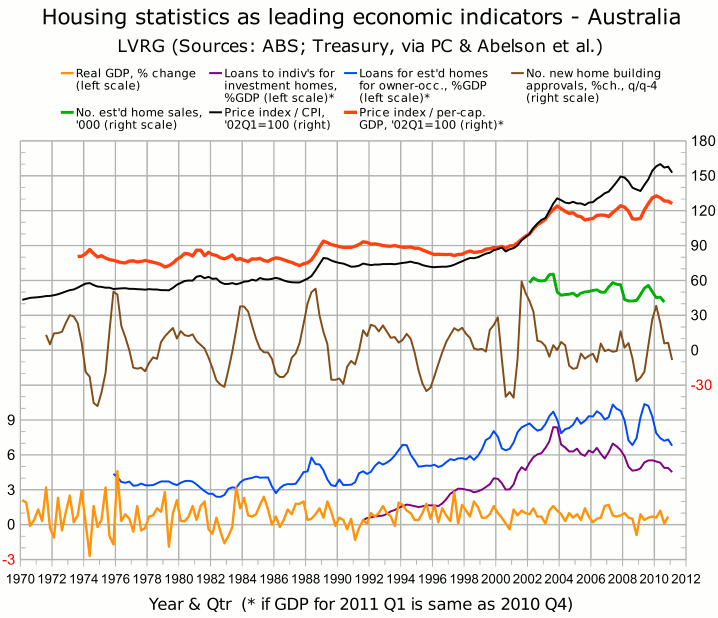
The same graph shows that the “Eight Capital Cities” price index continued to decline into Q1 of 2011, both in real terms (black curve) and in proportion to per-capital GDP (red curve). In consequence of that decline, our estimate of the overvaluation of Australian housing, which peaked at about 45% in Q2 of 2010, is now more like 40%.
Perhaps more interesting, although six months further out of date, is the number of sales of established homes (green curve), which the ABS has collected since the beginning of 2002, and which fell to a record low in Q3 of 2010. The subsequent history of sales may be inferred from the lending figures.
(Complete sources for the graph are given in the post of Nov.11.)
RP Data's sales figures are available up to February 2011, although the figures for the last six months are “modeled” in an attempt to compensate for incomplete information from State governments. The “modeled” figures indicate that volumes in Q4 of 2010 were about the same as in Q3 of 2008, and slightly lower than in Q4 of 2008 (in which the economy contracted 0.9%).
It was also in Q4 of 2010 that residential land sales fell to a 10-year low nationwide, and a 16-year low in Melbourne (as widely reported in the media on 18th and 19th April).
The figures on lending, home sales and land sales are all consistent with a slump in demand, which according to precedents will cause a slump in prices, which in this case means an acceleration of the price decline that has been in progress since May last year.
AFG reports that mortgage sales in April 2011 were almost 10% down on April 2010. Month-on-month comparisons were less meaningful, due to public holidays and the lack of seasonal adjustment. The more comprehensive, seasonally-adjusted ABS lending figures for April are due to be released on June 8.
