


Investment home lending still at sub-GFC levels
And lending for owner-occupied established homes is only slightly above the GFC trough, writes Gavin R. Putland.
On the release of the ABS housing finance figures for June 2011, David Llewellyn-Smith (a.k.a. “Houses and Holes” at MacroBusiness) announced “Housing finance bounce ends”. That assessment is supported by the seasonally-adjusted lending for “investment housing - purchase for rent or resale by individuals” (Table 11, series A2413064K), which was lower in June than in April or May. If the same series is aggregated quarterly and scaled to GDP, the sum for Q2 is imperceptibly higher than that for Q1 (which was the lowest since Q2 of 2001), but still below the “GFC” minimum of Q3, 2008 — as shown by the purple curve in the following graph.*
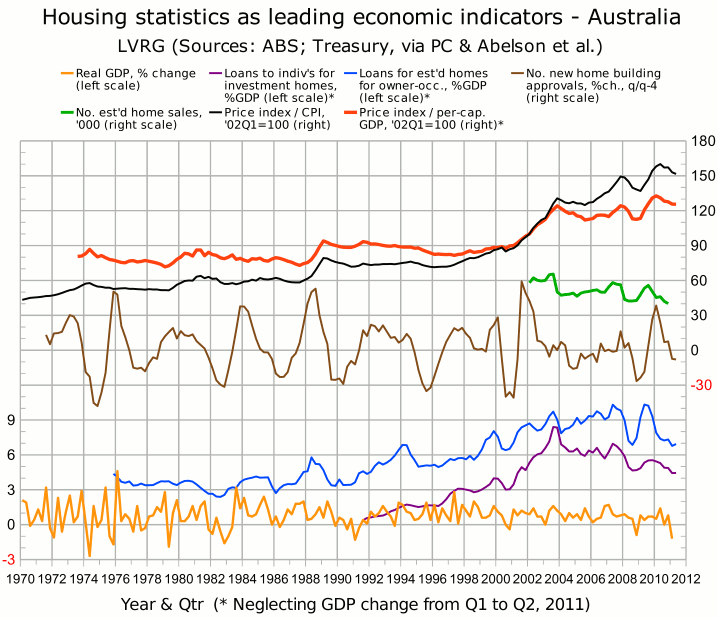
Seasonally-adjusted lending to buyers of established homes for owner-occupation, similarly aggregated and scaled, is shown by the blue curve. In Q1 of this year it was slightly below the “GFC” minimum; but in Q2 it was slightly above.
AFG's July figures suggest that home lending contracted further in July.
In Q2, the ABS “Eight Capital Cities” home price index continued its downward slide, both in real terms (black curve) and in proportion to per-capital GDP (red curve).
The number of sales of established homes (green curve), which the ABS has collected since the beginning of 2002, fell to a record low in Q3 of 2010, and broke that record in Q4.
Australian residential land sales, which fell to a 10-year low in Q4 of 2010, broke that record in Q1 of 2011, recording a 43% fall since the same quarter last year, and the sixth consecutive quarterly fall. Developers continue to blame taxes and planning restrictions rather than a collapse in demand.
The bearish news on new home sales, building approvals and retail sales has been summarized by Greg McKenna at MacroBusiness.
In July, the construction industry contracted for the 14th consecutive month, although the rate of contraction was slightly slower than in June. All four sub-sectors suffered falls in activity. House building fared the worst.
The trends in new home sales, building approvals and construction activity will have a negative impact on the second-quarter GDP result, to be released on Sep.7.
__________
* Sources for the graph are given in the notes to the Nov.11 post.
