


Housing investors party on like it's 2003
By Gavin R. Putland
Yesterday (12 May), the ABS released housing-finance figures for March 2015 (ABS 5609.0). In the following graph, the seasonally-adjusted value of lending for “owner occupation (secured finance) - purchase of other established dwellings”, aggregated quarterly and scaled to seasonally-adjusted GDP, is shown in blue. The seasonally-adjusted value of lending for “investment housing - purchase for rent or resale by individuals”, similarly aggregated and scaled, is shown in purple.
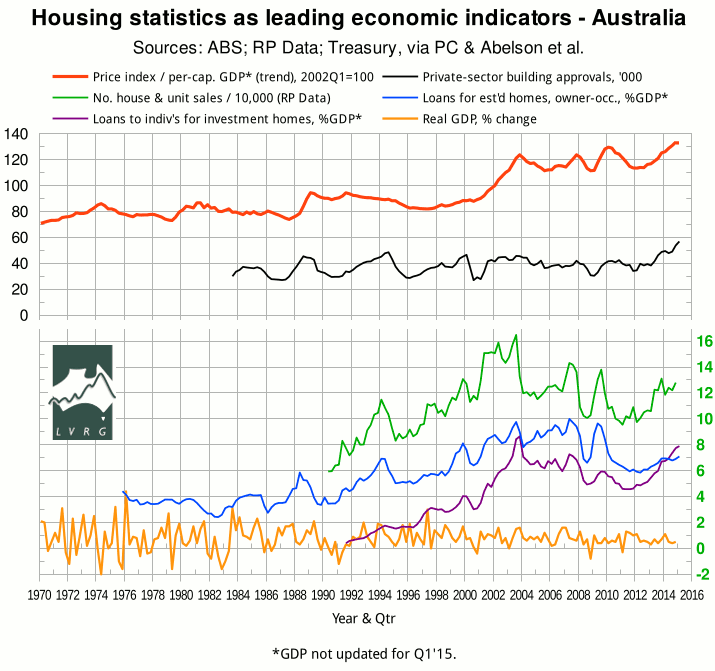
The recent flattening of the owner-occupation curve followed the discontinuation, in most states and territories, of first home buyers' grants for established homes. Meanwhile, investors bidding against FHBs for established homes can still claim negative gearing (and the present federal government has made a virtue of keeping it that way). This tilting of the playing field against owner-occupation helps to explain why the investment curve has crossed above the owner-occupation curve and is threatening to surpass its 2003 peak. The quarterly number of house and unit sales (green) shows a similar upward trend to investment lending, but has not yet reached the frenzied height of 2009, let alone 2003.
The ABS Eight Capital Cities house-price index,† scaled to per-capita GDP, is plotted in red (top curve, in which the last data point does not yet reflect the change in GDP from Q4 of 2014). The scaled index is at an all-time high, notwithstanding the simultaneous rise in building approvals (ABS 8731.0, black curve). Foreign property investors, unlike home-grown negative gearers, are obliged to buy or build new accommodation. But they are not obliged to seek tenants. How much of the building binge represents empty inner-city apartments owned by tenant-averse foreign investors is a matter of conjecture. It is clear, however, that a high percentage of inner-city apartments are indeed unoccupied.
The simultaneous rise of all five indicators since early 2012 is eerily reminiscent of the lead-up to the peak of 2003, except that building approvals have risen higher, causing a greater risk of a glut. Presumably the recent cut in official interest rates will keep the party going a bit longer. But the RBA is running out of sugar-hits. All of which suggests that when the music stops, the crash will be more spectacular than that of 2003-4; and this time the terms of trade will not come to the rescue.
__________
† The full sources for the home-price index are:
- 2002 Q1 onward (nominal): ABS 6416.0 Table 2;
- 1986 Q2 to 2002 Q1 (nominal): ABS 6416.0 Table 10;
- 1970 Q1 to 1986 Q2 (real): BIS-Shrapnel, Real Estate Institute of Australia, ABS; consolidated by Treasury; forwarded via Productivity Commission; inflation-adjusted and graphed in Abelson, Joyeux, Milunovich & Chung, “House Prices in Australia - 1970 to 2003 - Facts and Explanations” (Research Paper 0504, Dept. of Economics, Macquarie University, 2005), Figure A1 (p.26);
- CPI: ABS 6401.0 Tables 1&2, series A2325846C;
- Per-capital-GDP (current prices, trend): ABS 5206.0 Table 1. The trend figures from the ABS start in Q3 of 1973, but the unsmoothed (“original”) figures go back further. Accordingly, the available trend figures are extrapolated backward in one-year linear segments, replicating the year-on-year percentage changes in the unsmoothed figures. The earliest linear segment is extended back another half-year. Thus the timing of the 1974 peak in the red curve is not in doubt, but shape of the preceding upswing is less certain.
Sources for the other curves, in descending order, are as follows:
- Number of private-sector home-building approvals, seasonally adjusted (black): ABS 8731.0 Table 6, series A422006R, aggregated quarterly;
- Number of house/unit sales (green): RP Data, figures read from graphs in various monthly updates, aggregated quarterly;
- Lending to buy established homes for owner-occupation, seasonally adjusted (blue): ABS 5609.0 Table 11, series A2413062F, aggregated quarterly, divided by seasonally-adjusted GDP in current dollars (ABS 5206.0 Table 1);
- Lending to individuals to buy investment homes (purple): ABS 5609.0 Table 11, series A2413064K, aggregated quarterly, divided by seasonally-adjusted GDP in current dollars (as above);
- “Headline” GDP — chain volume, seasonally adjusted, % change (yellow): ABS 5206.0 Table 1.
