Property sales index points to home-grown recession
By Gavin R. Putland
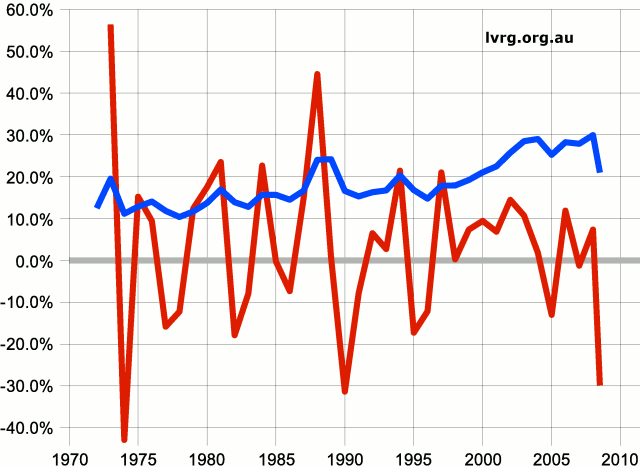
Early data received by the LVRG indicate that the ratio of property sales to GDP in Australia has fallen almost 30% from its peak in 2007-8. This is the largest fall since the 31.4% plunge that preceded the recession of 1990-1. Since 1972, whenever this ratio has fallen more than 17.5% from the last year to the present one, there has been a recession in the next year. Thus the ratio has been a leading indicator of recession.
The “early” data are from South Australia and Western Australia only, and the “30%” fall is calculated by comparing the whole of 2007-8 with the first half of 2008-9 in those two States. If, in an attempt to reduce seasonal influences, we compare the first halves of the two financial years, the calculated fall becomes 35% — the largest since the 1974-5 recession. The following graph uses the more optimistic (30%) estimate.
Kavanagh-Putland Index for Australia (blue)
with annual change (red)
The blue curve shows the Kavanagh-Putland Index, which is an estimate of the ratio of property sales to GDP (see “Introducing the Kavanagh-Putland Index”). The red curve shows the year-on-year fractional change in the Index. In the past, recession has followed whenever the red curve has fallen below −17.5%.
Auction data, which have the advantage of being more recent, but the disadvantage of including only numbers of properties (not value) and only one mode of sale, suggest that even a 35% fall is optimistic. On February 23, the Murdoch press reported that for Sydney, Melbourne, Adelaide and Brisbane, the combined number of properties sold at auction so far this year was less than a third of that for the same period last year [1]. The positive influence of the First Home Owners' Boost was apparently confined to the low end of the market.
Price statistics show that the fall in turnover is driven primarily by falling effective demand, consistent with a recession-inducing crash (see “Introducing the Kavanagh-Putland Index”). For commercial property, according to the Property Council / IPD Australian Property Index, capital “growth” up to December 2008 was −4.1% for the quarter and −4.3% for the year, while total returns (rent plus capital “growth”) were the lowest since the market recovered from the 1990-1 recession [2]. Notice that the capital loss has been concentrated in the most recent quarter. Meanwhile the Reserve Bank reports that home prices, according to all three sources cited (Australian Bureau of Statistics [ABS], Australian Property Monitors, and RP Data-Rismark), declined in both the quarter and the year to December 2008 [3]. In particular, the ABS weighted average of eight capital cities was down 3.3% in the year to December — apparently the largest year-on-year fall since records began [4]. But these declines are trivial compared with the write-downs reported by major corporate players in the Australian property sector for the half-year to December [5].
The property bubble that led to the present crash and ensuing recession was not imported from the USA or China or Japan. It was entirely home-grown under the policies of the Howard-Costello government — in contrast to the property bubble of the late 1980s which gave us the Recession We Had To Have, and which was entirely home-grown under the policies of the Hawke-Keating government.
When will/did the Australian recession start?
The continuing debate over whether Australia will avoid recession (“continuing” at least as late as February 25) would be comical if the subject were not so serious. Considering only the Kavanagh-Putland Index and its behaviour preceding past recessions, we would have to predict recession in 2009-10 while remaining noncommittal on whether the contraction would/did begin before the end of 2008-9. The signs pointing to an earlier onset of contraction include
- the speed of the fall in property sales,
- auction data suggesting further falls in property sales in the second half of the financial year,
- the decline in home prices, which continued through the December quarter in spite of the First Home Owners' Boost,
- the collapse in demand for Australian exports, and
- the decline in employment since October 2008, and the highly publicized outbreak of mass sackings.
To the contrary, the artificially “stimulated” Christmas retail binge and the high capital investment for the December quarter (presumably undertaken in fulfillment of contracts signed in more optimistic times) are likely to have maintained positive growth for that quarter [6].
On balance, then, let us say that the chances of a recession beginning in the December quarter of 2008 are somewhat less than 50%, that the chances of a recession beginning in the March quarter of 2009 are somewhat more than 50%, and that the chances of avoiding recession through 2009 are somewhere between zero and Buckley's. In short, the question to be answered by Wednesday's release of the December-quarter GDP result is “When did the recession start?”
References
[1] Sanna Trad, “Sales dry up unless the price is right”, The Australian, Feb.23, 2009.
[2] Cf. Katherine Jimenez, “Property returns lowest in 15 years”, The Australian, Feb.21, 2009.
[3] Reserve Bank of Australia, Statement on Monetary Policy, February 2009, p.34.
[4] Graph 33 from the RBA's Statement on Monetary Policy for February 2008 includes ABS data from 1990.
[5] Stephen Mayne, “Record property losses, but it should have been much more”, Crikey, Feb.26, 2009, item 4.
[6] Glenn Dyer, “Strong ABS investment figure prompts positive GDP talk”, Crikey, Feb.26, 2009, item 1.


